Fig. 26.

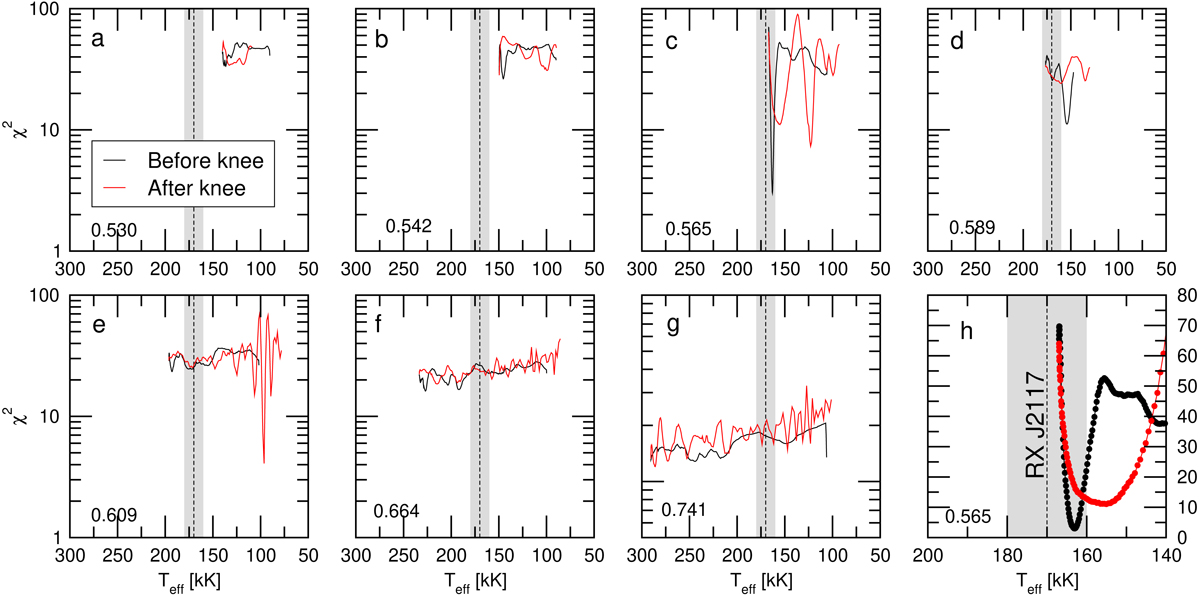
Quality function of the period fit in terms of the effective temperature for the PG 1159 sequences with different stellar masses (in solar units), indicated at the left bottom corner of each panel. Black (red) lines correspond to stages before (after) the evolutionary knee (see Fig. 1). Only the periods with m = 0 (see Table 9) have been considered. The strong minimum in panel c corresponds to M⋆ = 0.565 M⊙. Panel h is a zoom of the region with the strong minimum seen in panel c; the y-axis scale is linear in this case. The vertical dashed line is the spectroscopic Teff of RX J2117 (170 kK), and the gray zone depicts its uncertainties (±10 kK).
Current usage metrics show cumulative count of Article Views (full-text article views including HTML views, PDF and ePub downloads, according to the available data) and Abstracts Views on Vision4Press platform.
Data correspond to usage on the plateform after 2015. The current usage metrics is available 48-96 hours after online publication and is updated daily on week days.
Initial download of the metrics may take a while.


