Free Access
Fig. 11.
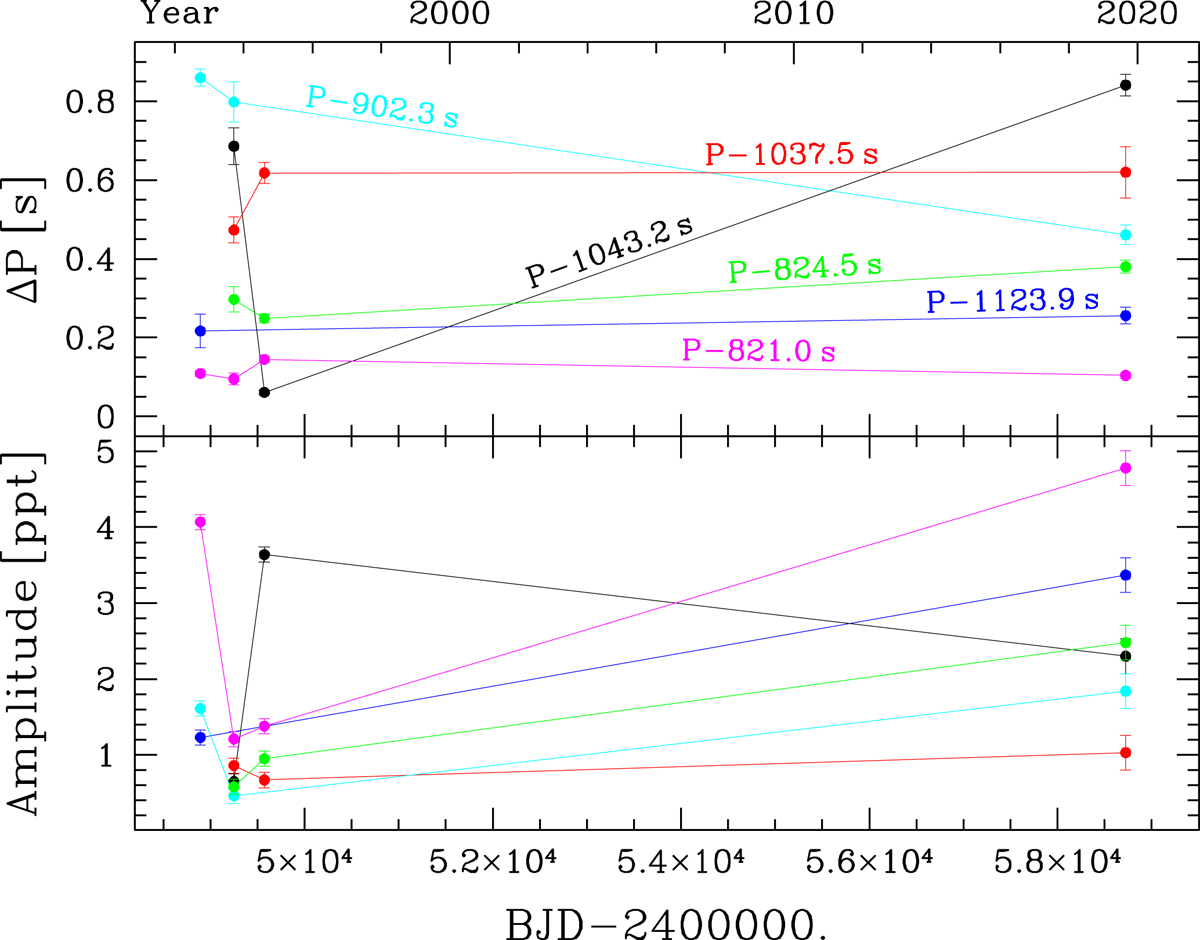
Period variations (upper panels) and amplitudes (lower panels) of the six periods of RX J2117 that are common to the Vauclair et al. (2002) and TESS datasets. In the upper panel we have subtracted a constant value from each period in order to fit all periods within a narrow range.
Current usage metrics show cumulative count of Article Views (full-text article views including HTML views, PDF and ePub downloads, according to the available data) and Abstracts Views on Vision4Press platform.
Data correspond to usage on the plateform after 2015. The current usage metrics is available 48-96 hours after online publication and is updated daily on week days.
Initial download of the metrics may take a while.