Fig. 11.
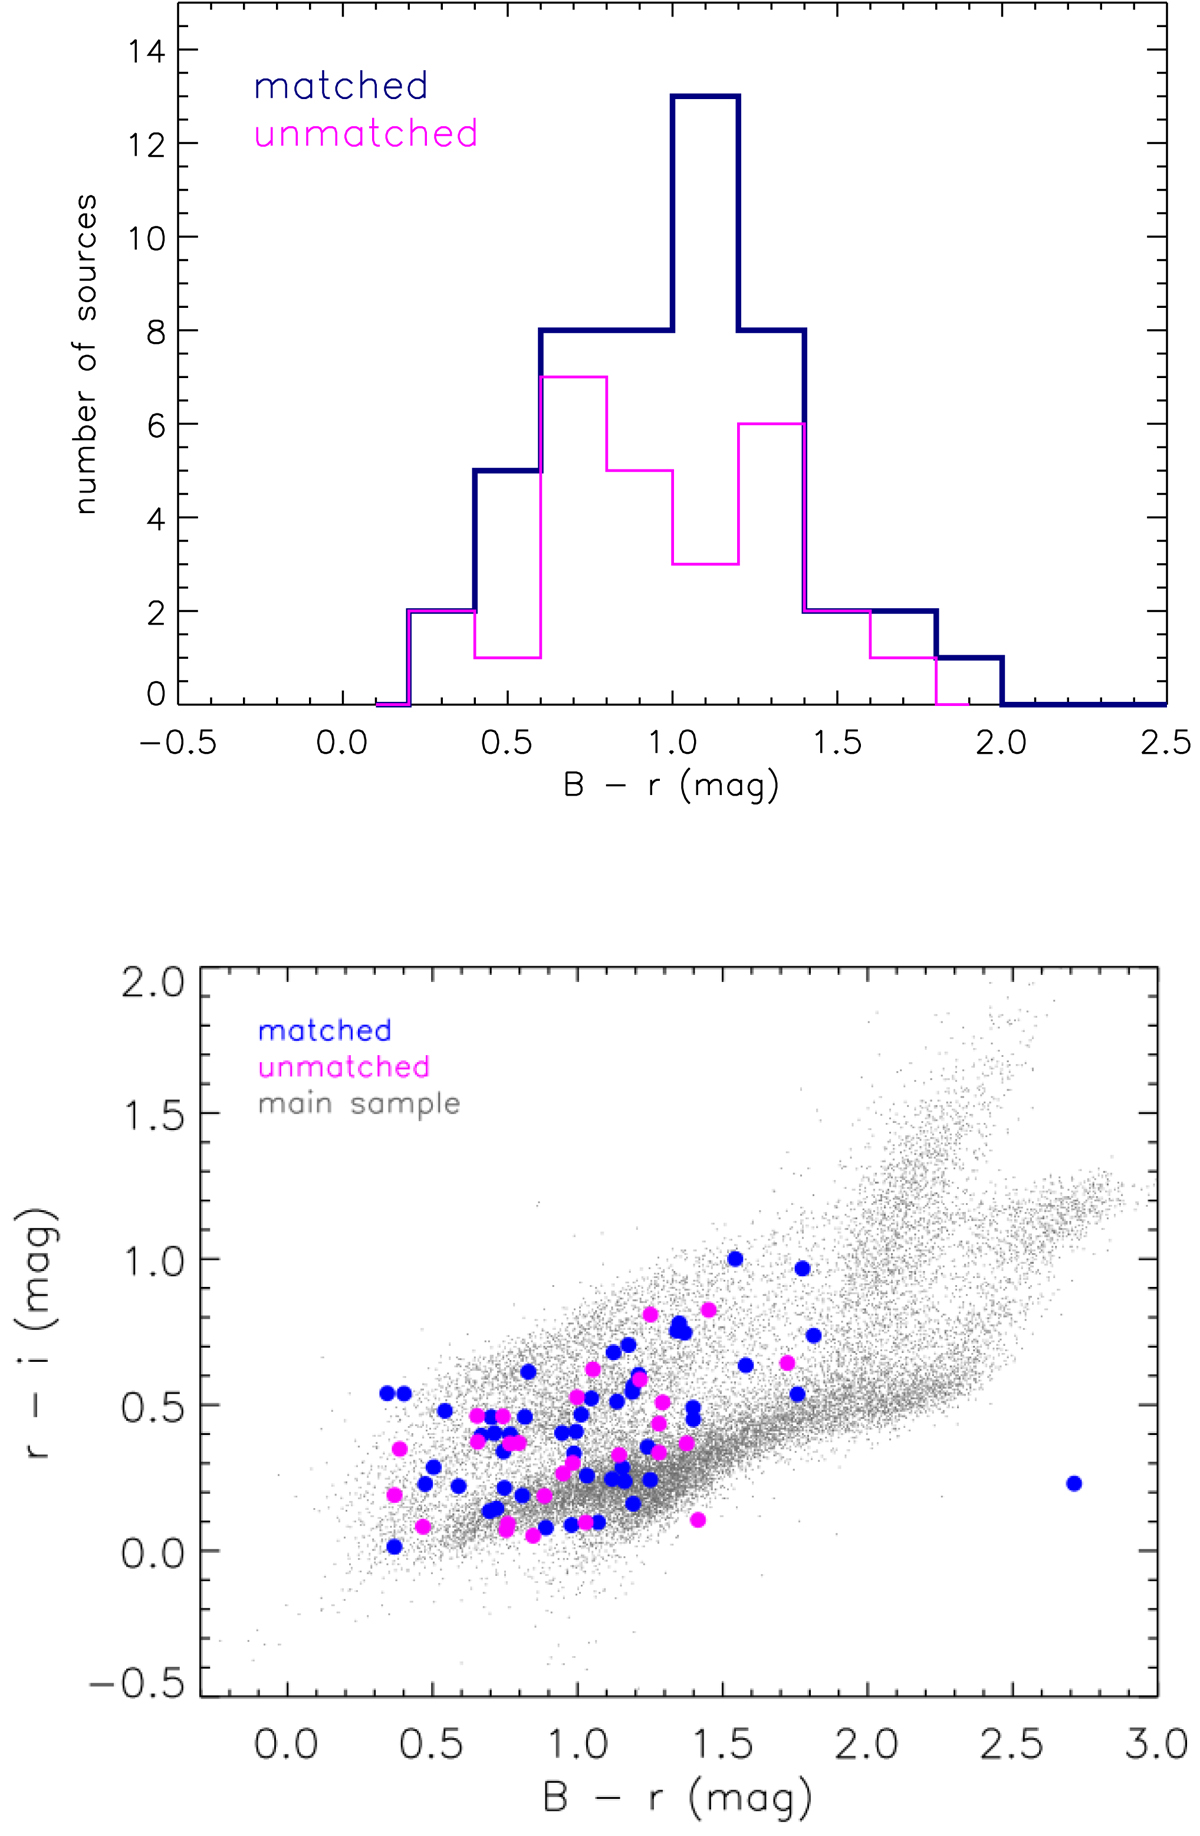
Distribution of the color B − r (upper panel) and color-color diagram comparing B − r and r − i (lower panel) for the sample of matched (blue) and unmatched (magenta) sources obtained comparing the RF5 and RFspec21 samples of AGN candidates. In the color-color diagram, the main sample sources are also shown as a reference (gray).
Current usage metrics show cumulative count of Article Views (full-text article views including HTML views, PDF and ePub downloads, according to the available data) and Abstracts Views on Vision4Press platform.
Data correspond to usage on the plateform after 2015. The current usage metrics is available 48-96 hours after online publication and is updated daily on week days.
Initial download of the metrics may take a while.