Open Access
Fig. 3
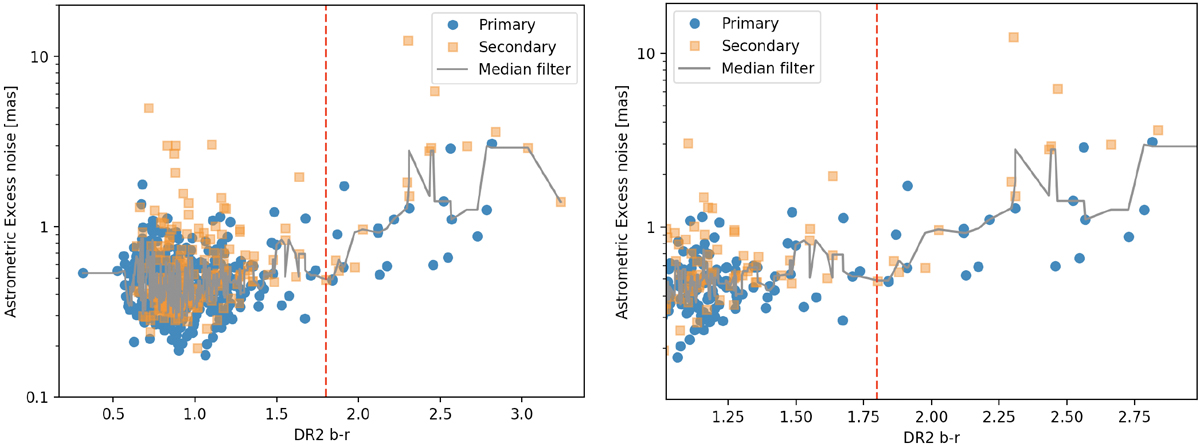
Astrometric excess noise with respect to b − r color index from Gaia DR2 for the 614 sources with G > 6.4. The right panel represents a magnification of the region with a positive correlation around the limiting color b − r =1.8 (red dashed line). Symbols and color are similar to Fig. 1.
Current usage metrics show cumulative count of Article Views (full-text article views including HTML views, PDF and ePub downloads, according to the available data) and Abstracts Views on Vision4Press platform.
Data correspond to usage on the plateform after 2015. The current usage metrics is available 48-96 hours after online publication and is updated daily on week days.
Initial download of the metrics may take a while.