Fig. C.1
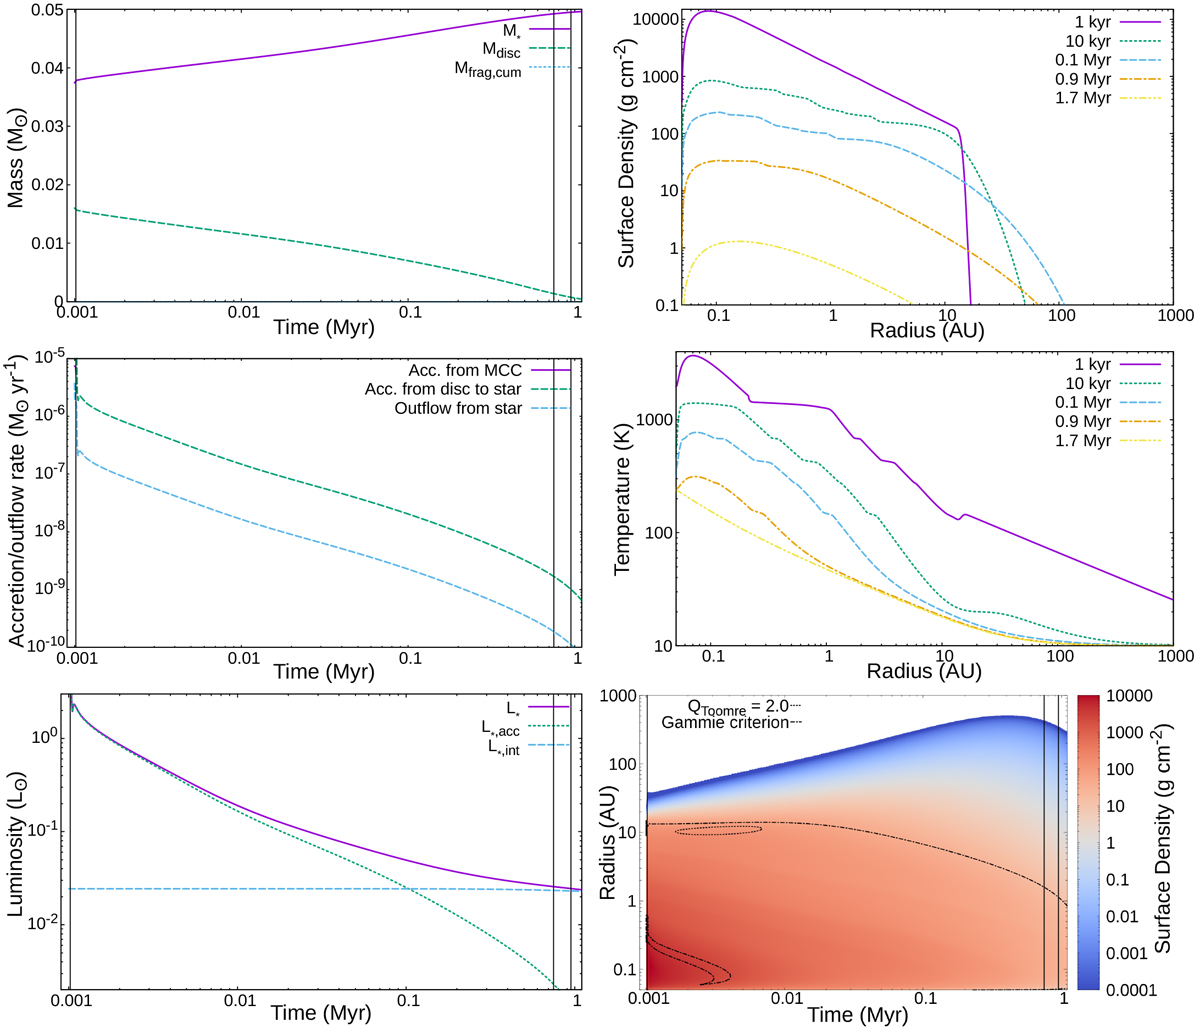
Time evolution of system 0004 from RUN-2 “MHD”. Top left panel: stellar mass, disc mass and, cumulative mass removed from the disc by fragmentation. Middle left panel: accretion and outflow rates. Bottom left panel: stellar luminosity. Top right panel: surface density at different times. Middle right panel: midplane temperature at different times. Bottom left panel: stellar luminosity (accretion and intrinsic). Bottom right panel: contour plot of the surface density with fragmentation criteria (see main text). The black vertical lines denote, in order of increasing time: tinfall ≈ 1.02 kyr, tpms ≈0.75 Myr and tNIR ≈ 0.95 Myr (see Sect. 4).
Current usage metrics show cumulative count of Article Views (full-text article views including HTML views, PDF and ePub downloads, according to the available data) and Abstracts Views on Vision4Press platform.
Data correspond to usage on the plateform after 2015. The current usage metrics is available 48-96 hours after online publication and is updated daily on week days.
Initial download of the metrics may take a while.