Fig. 8
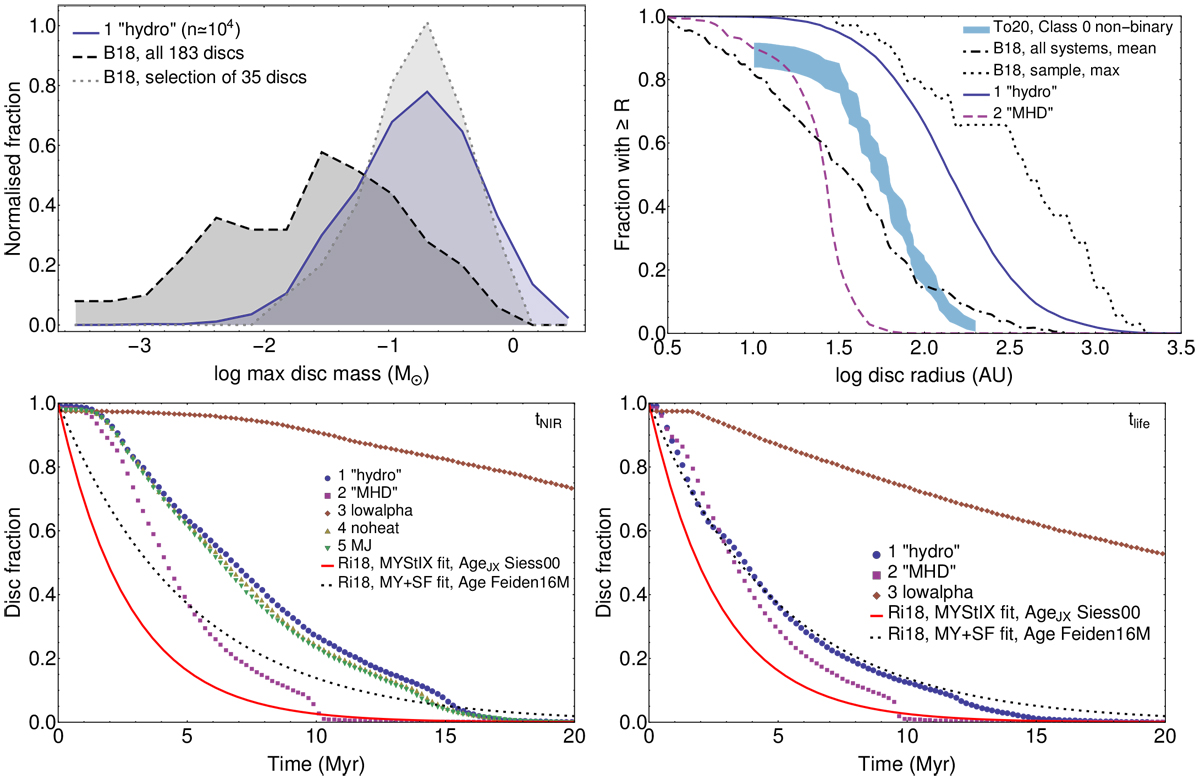
Comparisons of our results to previous studies and observations. Comparison of, top left: maximum disc masses from RUN-1 with those from the simulations of B18. Top right: disc radii at the end of the infall phase with observed Tobin et al. (2020, To20) and simulated B18 Class 0 radii. Bottom: disc fractions as a function of time with fits from Richert et al. (2018, Ri18); left: tNIR, right: tlife (reduced, see Sect. 2.8). RUN-4 and RUN-5 are indistinguishable from RUN-1 in the bottom right panel and omitted.
Current usage metrics show cumulative count of Article Views (full-text article views including HTML views, PDF and ePub downloads, according to the available data) and Abstracts Views on Vision4Press platform.
Data correspond to usage on the plateform after 2015. The current usage metrics is available 48-96 hours after online publication and is updated daily on week days.
Initial download of the metrics may take a while.