Fig. 3
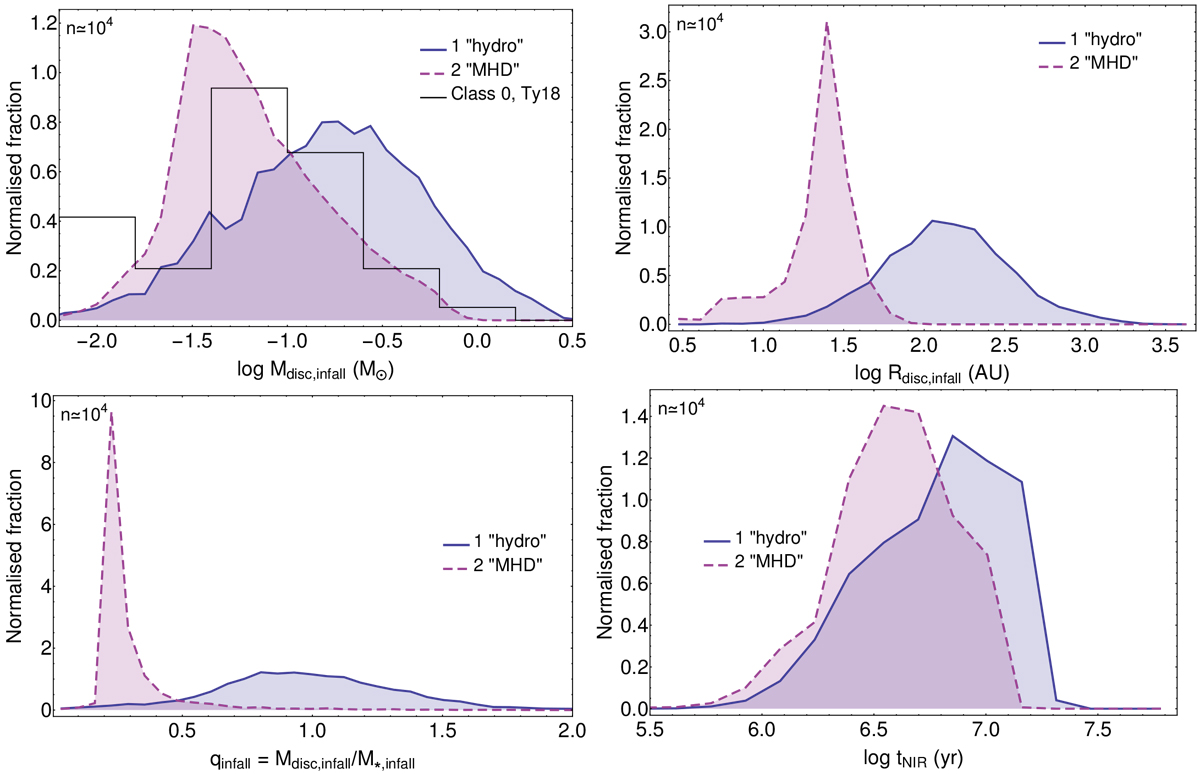
Distributions of the disc properties at the end of infall and lifetimes of the discs for RUN-1 and RUN-2. Top left: disc masses, top right: disc radii including the observational result of Tychoniec et al. (2018) (Ty18), bottom left: disc-to-star mass ratio qinfall, bottom right: disc lifetimes. All stellar masses are included in this figure.
Current usage metrics show cumulative count of Article Views (full-text article views including HTML views, PDF and ePub downloads, according to the available data) and Abstracts Views on Vision4Press platform.
Data correspond to usage on the plateform after 2015. The current usage metrics is available 48-96 hours after online publication and is updated daily on week days.
Initial download of the metrics may take a while.