Fig. A.1
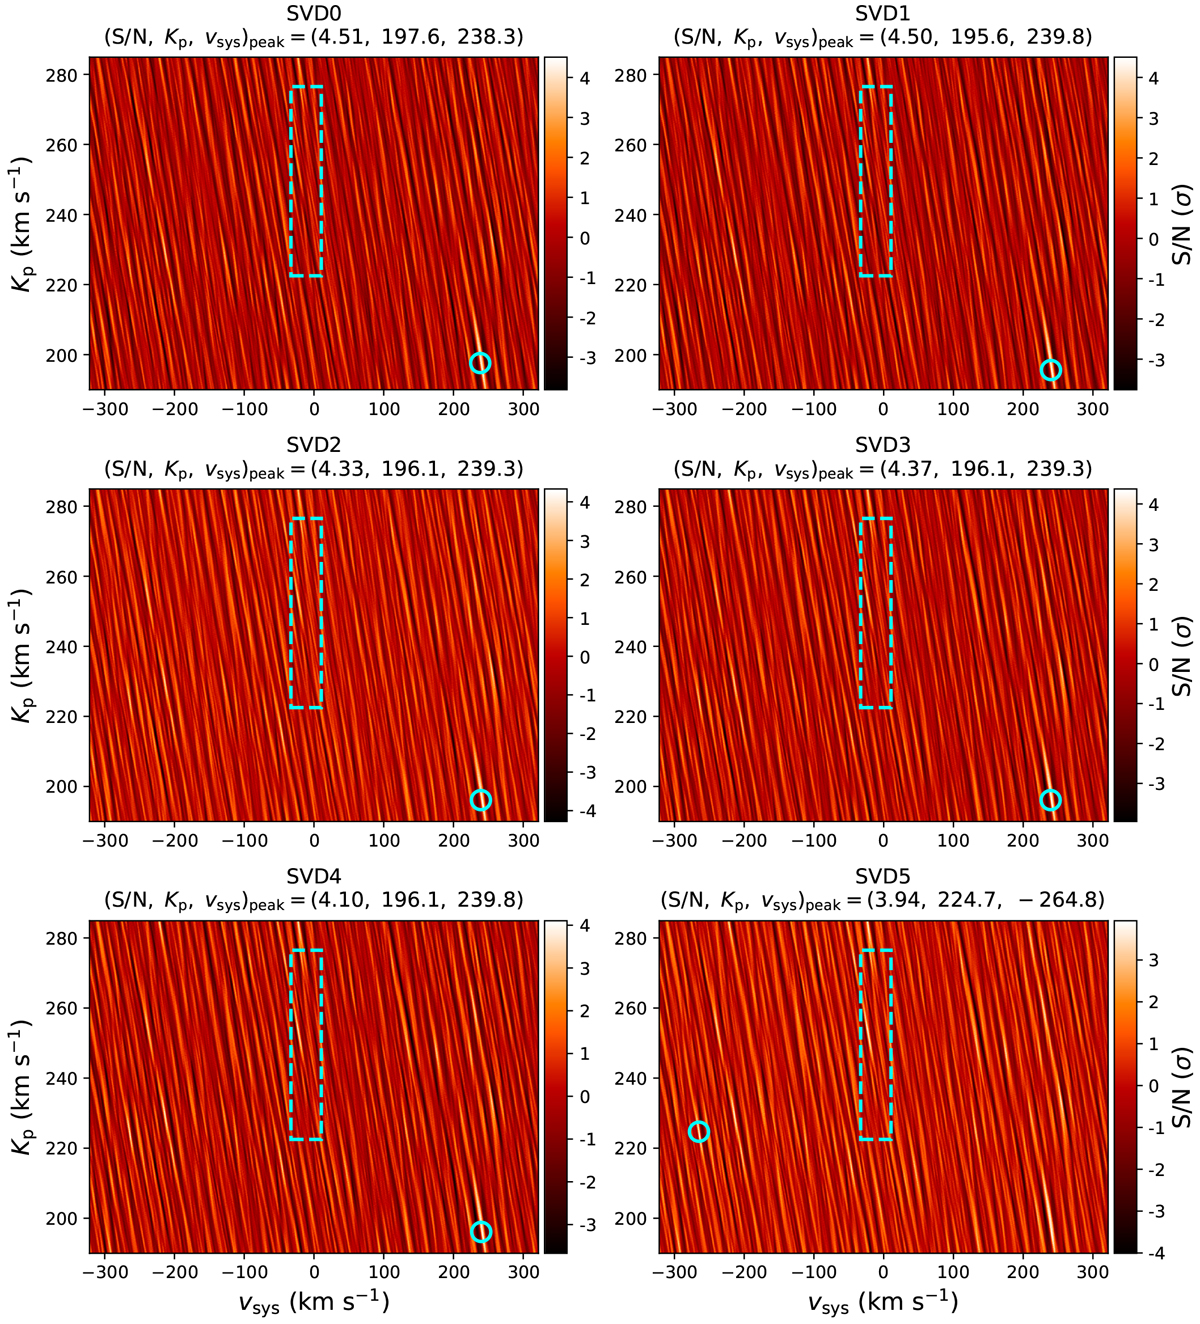
Kp-vsys matrices of S∕N values for the ![]() ExoMol TOTO model, as described in Sect. 3.3. Each panel corresponds to the matrix for a different SVD iteration (0–5), indicated above each panel. The strongest peak is marked on each matrix with a cyan ring and noted above each panel with the corresponding values of Kp and vsys. The dashed cyan box indicates the region where peaks must be found to be considered “significant,” as described in Sect. 4.
ExoMol TOTO model, as described in Sect. 3.3. Each panel corresponds to the matrix for a different SVD iteration (0–5), indicated above each panel. The strongest peak is marked on each matrix with a cyan ring and noted above each panel with the corresponding values of Kp and vsys. The dashed cyan box indicates the region where peaks must be found to be considered “significant,” as described in Sect. 4.
Current usage metrics show cumulative count of Article Views (full-text article views including HTML views, PDF and ePub downloads, according to the available data) and Abstracts Views on Vision4Press platform.
Data correspond to usage on the plateform after 2015. The current usage metrics is available 48-96 hours after online publication and is updated daily on week days.
Initial download of the metrics may take a while.