Fig. 7
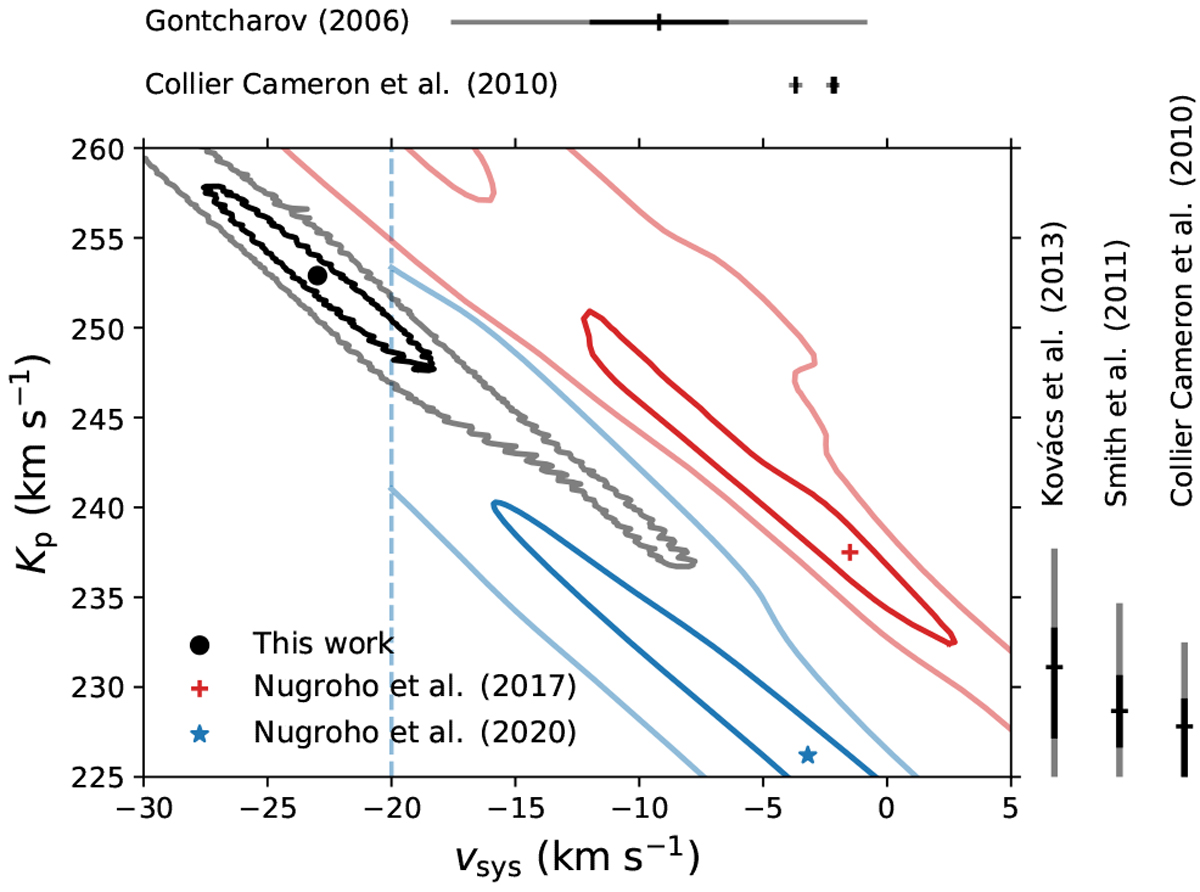
Comparison of various reported values of Kp and vsys for theWASP-33 system. Our result is indicated by the circular marker, along with 1σ and 3σ contoursin black and gray, respectively. The corresponding results from Fig. 14 in Nugroho et al. (2017) for TiO are also plotted, with the location of their S∕N peak denoted by the cross marker and the 1σ and 3σ contours shown in dark and light red. The S∕N peak from the recent Nugroho et al. (2020) Fe I detection is indicated by the star marker, with the 1σ and 3σ contours from the S∕N matrix shown as solid dark blue and solid light blue lines. The vsys = −20 km s-1 lower limit in their analysis caused by stellar pulsations is denoted by the dashed blue line. Previously reported values for vsys (Gontcharov 2006; Collier Cameron et al. 2010) and Kp (Kovács et al. 2013; Smith et al. 2011; Collier Cameron et al. 2010) are shown above and to the right of the plot, with the strokes indicating the reported values, and the extended black and gray bars denoting the 1σ and 3σ errors, respectively. The negative errors for the Kp values are clipped for clarity.
Current usage metrics show cumulative count of Article Views (full-text article views including HTML views, PDF and ePub downloads, according to the available data) and Abstracts Views on Vision4Press platform.
Data correspond to usage on the plateform after 2015. The current usage metrics is available 48-96 hours after online publication and is updated daily on week days.
Initial download of the metrics may take a while.