Fig. 6
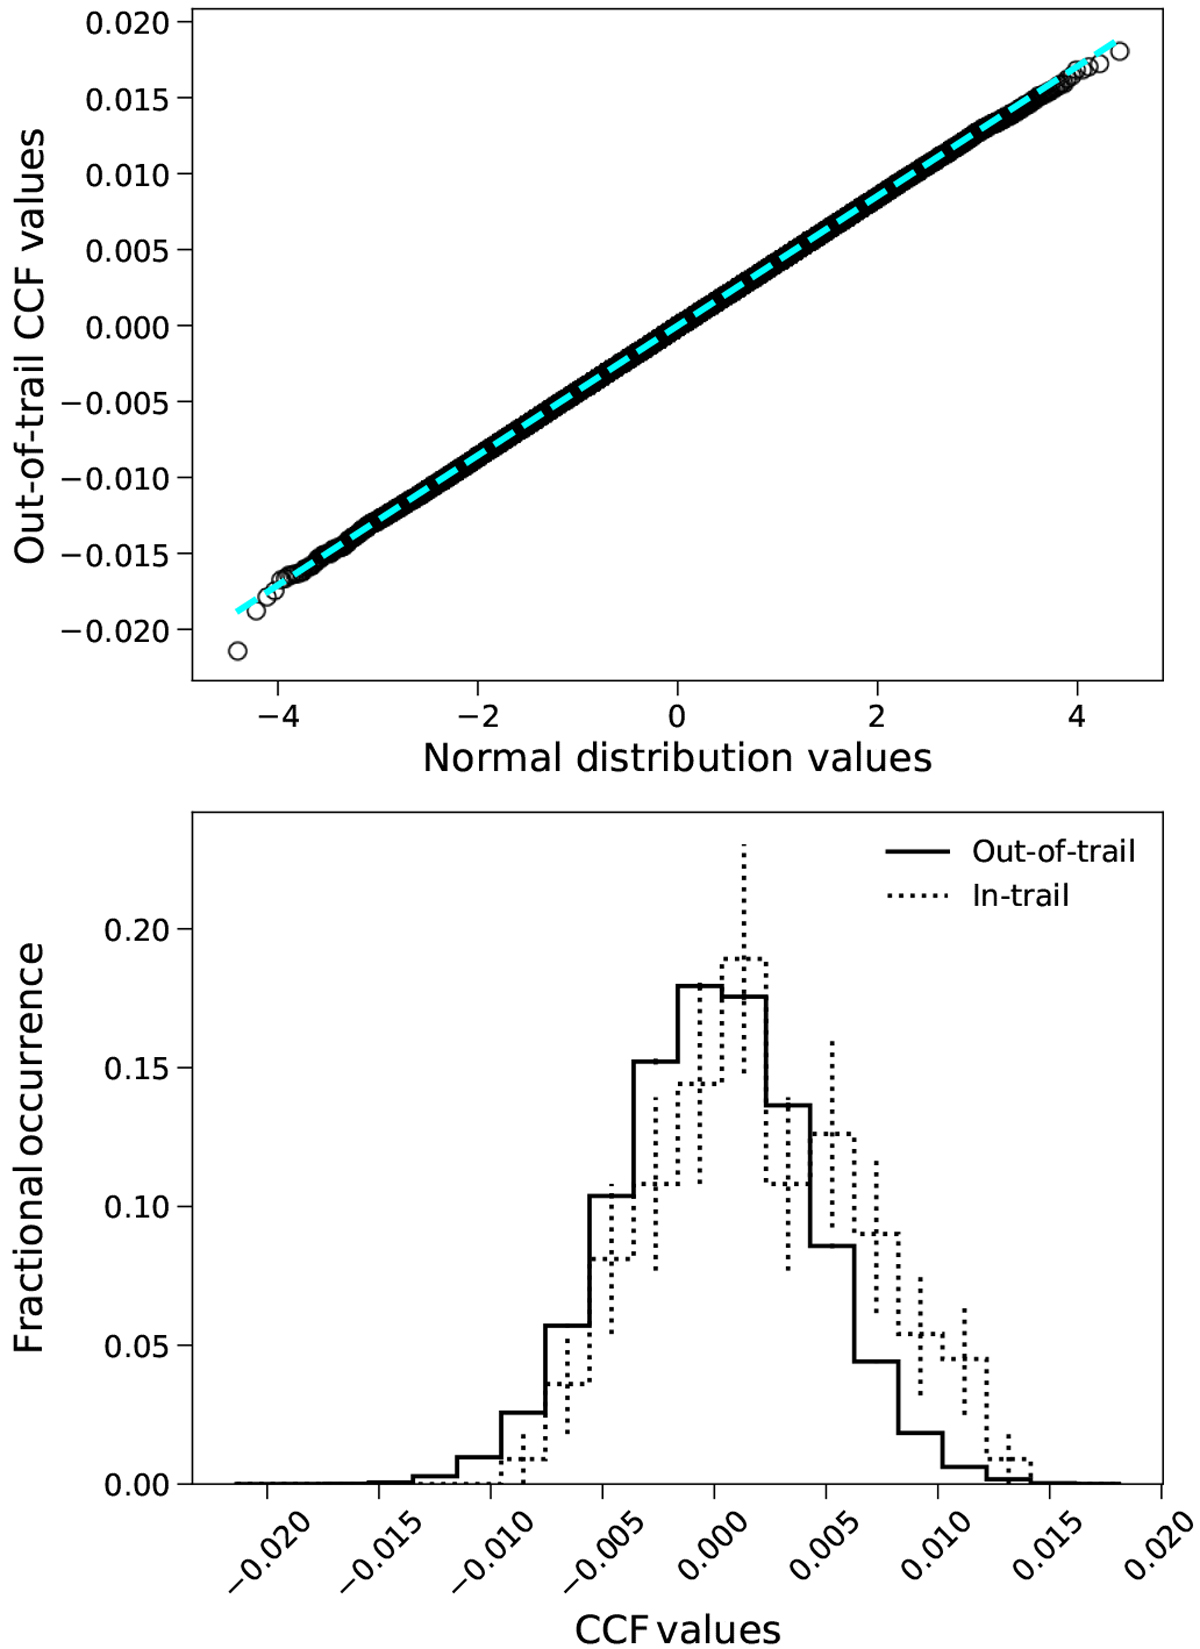
Top panel: probability plot comparing the binned out-of-trail CCF values to a sampling of the normal distribution (black rings). The dashed cyan line is the calculated linear regression. That the correlation so closely follows a linear trend indicates the out-of-trail values are well described by a Gaussian out to ± 4σ . Bottom panel: histogram of the binned in- (dotted line) and out-of-trail (solid line) CCF values. Error bars were calculated as the square root of the individual bin count, normalized by the sample size. A two-sided Welch’s t-test gives a 4.3σ rejection of the null hypothesis that both populations are draw from the same distribution.
Current usage metrics show cumulative count of Article Views (full-text article views including HTML views, PDF and ePub downloads, according to the available data) and Abstracts Views on Vision4Press platform.
Data correspond to usage on the plateform after 2015. The current usage metrics is available 48-96 hours after online publication and is updated daily on week days.
Initial download of the metrics may take a while.