Fig. 5
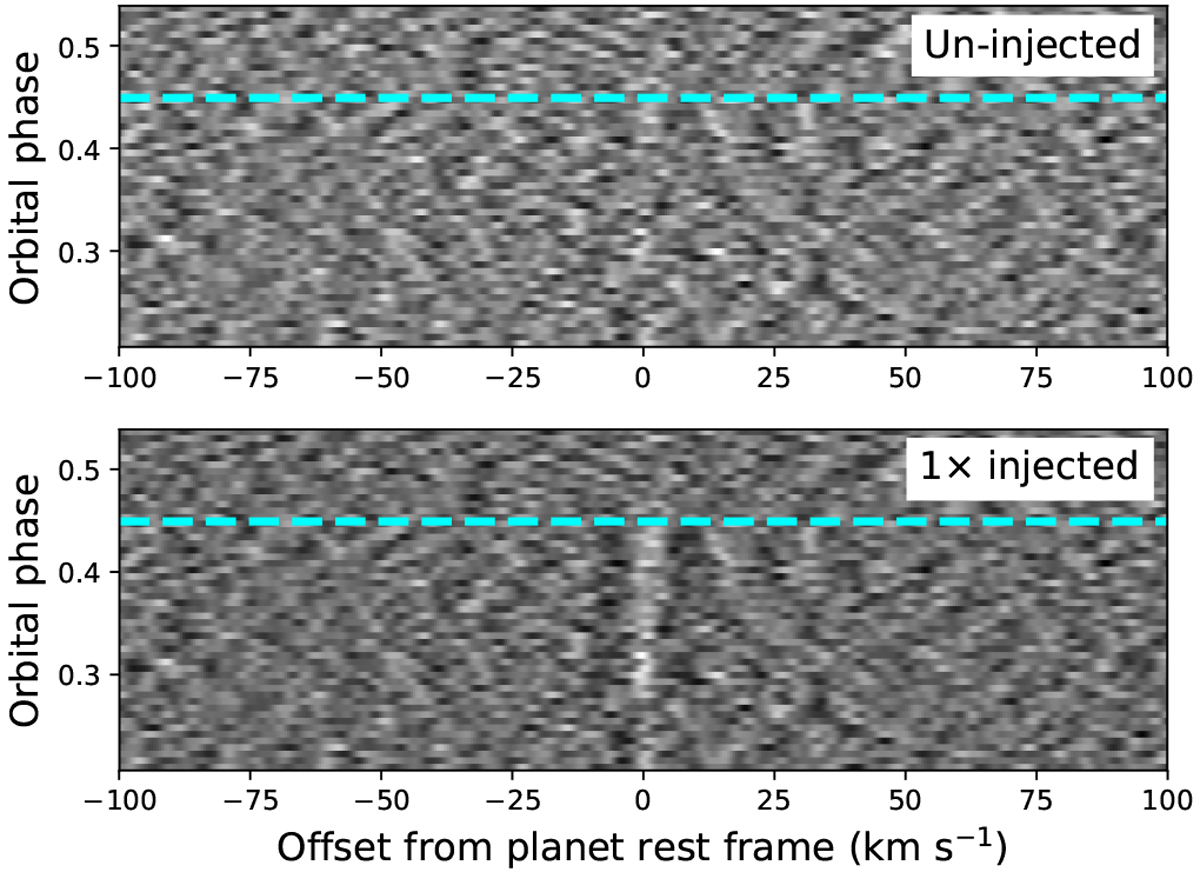
Top panel: two-dimensional CCF matrix for the ![]() model and SVD6 data matrix aligned to the exoplanet rest frame for
model and SVD6 data matrix aligned to the exoplanet rest frame for ![]() . Each row is the one-dimensional CCF for a given observation. The first observation in occultation is denoted by the dashed cyan line. Orbital phase values 0 and 0.5 correspond to the center of transit and occultation, respectively.Bottom panel: same for the injection test discussed in Sect. 4.2. In this case, the velocities
. Each row is the one-dimensional CCF for a given observation. The first observation in occultation is denoted by the dashed cyan line. Orbital phase values 0 and 0.5 correspond to the center of transit and occultation, respectively.Bottom panel: same for the injection test discussed in Sect. 4.2. In this case, the velocities ![]() were used to shift to the exoplanet rest frame.
were used to shift to the exoplanet rest frame.
Current usage metrics show cumulative count of Article Views (full-text article views including HTML views, PDF and ePub downloads, according to the available data) and Abstracts Views on Vision4Press platform.
Data correspond to usage on the plateform after 2015. The current usage metrics is available 48-96 hours after online publication and is updated daily on week days.
Initial download of the metrics may take a while.