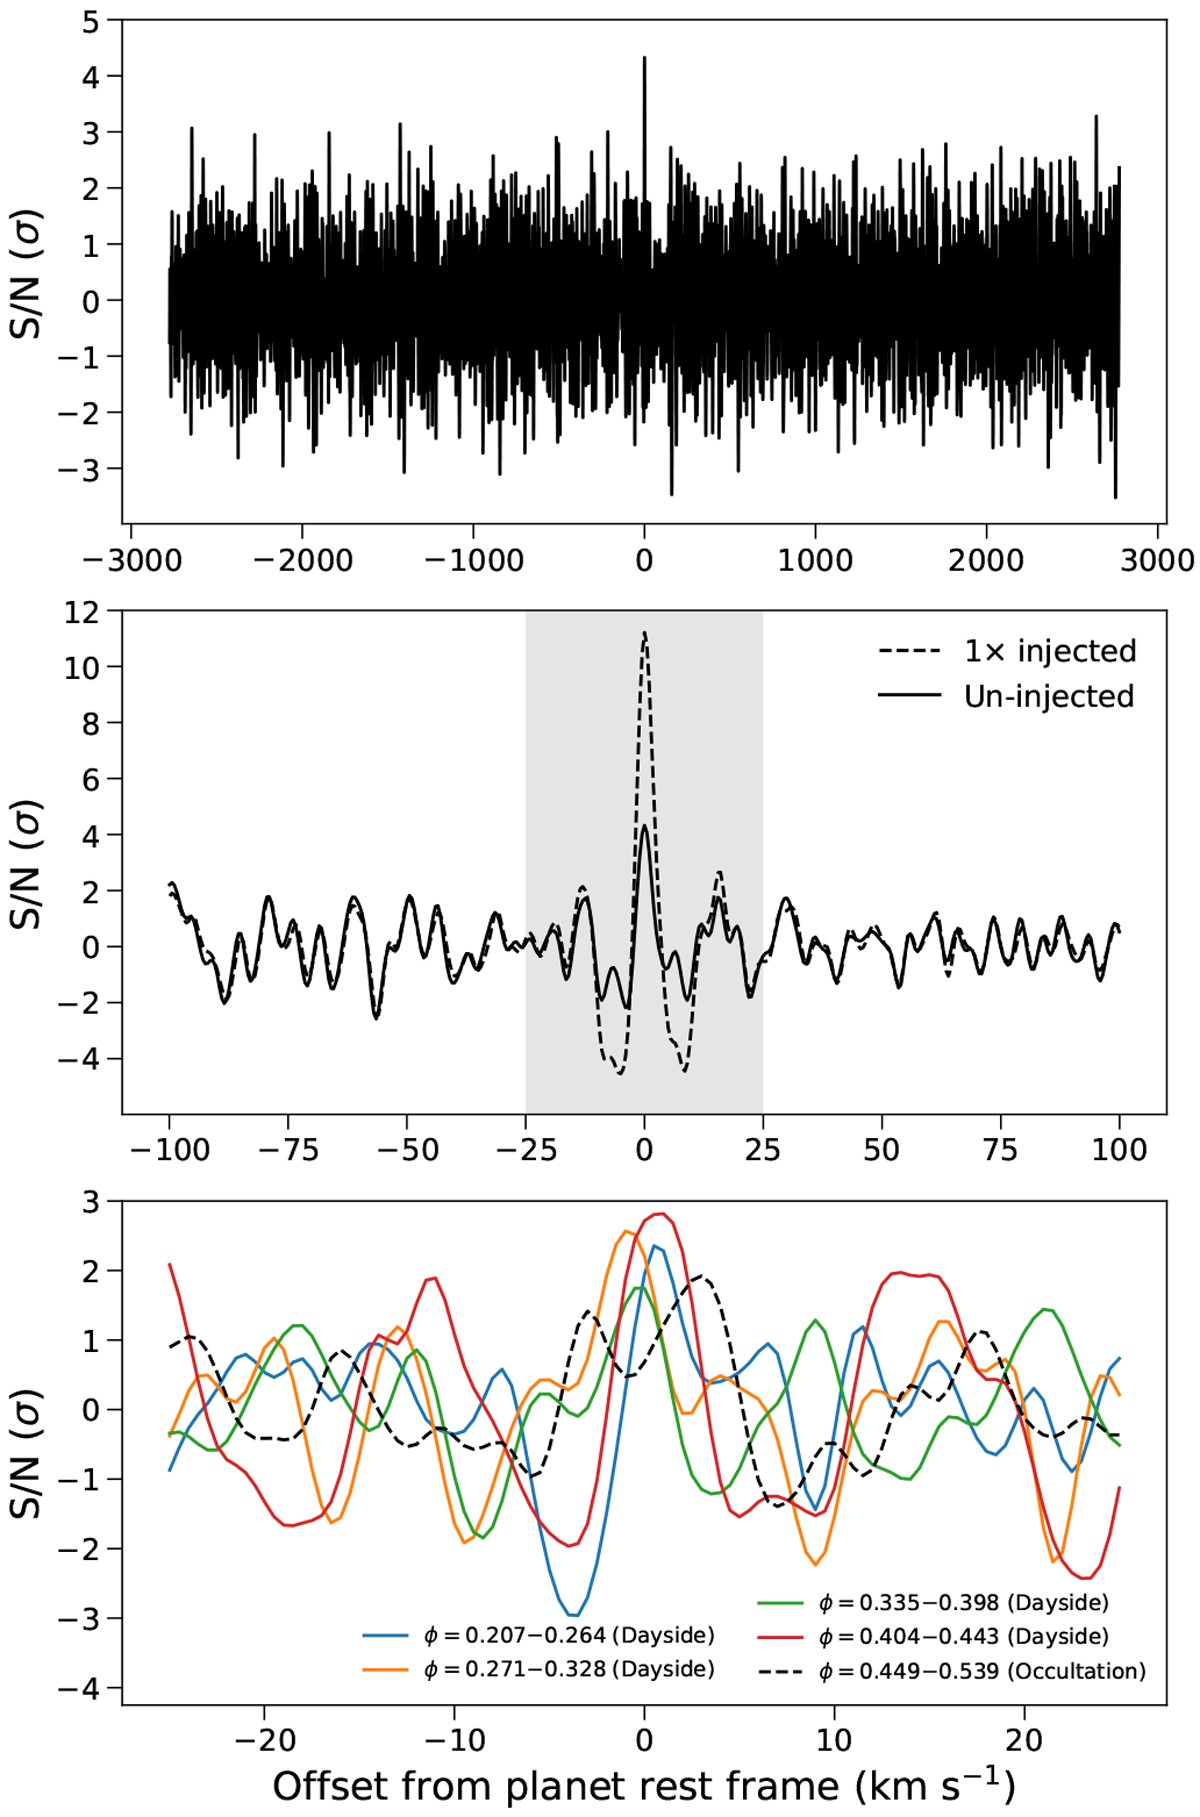
Fig. 4

Top panel: one-dimensional out-of-occultation CCF for the ![]() model and the SVD6 data matrix aligned to
model and the SVD6 data matrix aligned to ![]() . The CCF values were converted to S∕N values by dividing by the standard deviation outside ±25 km s-1. Middle panel: same, but on a narrower offset velocity range. The solid line plots the un-injected curve shown in the top panel, while the dashed line denotes the result of the 1× injection case aligned to
. The CCF values were converted to S∕N values by dividing by the standard deviation outside ±25 km s-1. Middle panel: same, but on a narrower offset velocity range. The solid line plots the un-injected curve shown in the top panel, while the dashed line denotes the result of the 1× injection case aligned to ![]() . The shaded region denotes the ±25 km s-1 range that was excluded from the noise calculation. The peak S∕N of the injected case is 2.6× that of the un-injected case. Bottom panel: same as top panel, but instead of combining the out-of-occultation CCFs into a single one-dimensional CCF, we sequentially summed the individual CCFs for various portions of the observing night. Observations 1–37 are completely out of occultation. The CCFs of observations 1–30 are summed in sets of ten and denoted by the solid blue, orange, and green lines. The solid red line shows the combined CCF of observations 31–37. Observations 38–52 contain ingress and full occultation, and the combined CCF for these 15 observations is shown in the dashed black line.
. The shaded region denotes the ±25 km s-1 range that was excluded from the noise calculation. The peak S∕N of the injected case is 2.6× that of the un-injected case. Bottom panel: same as top panel, but instead of combining the out-of-occultation CCFs into a single one-dimensional CCF, we sequentially summed the individual CCFs for various portions of the observing night. Observations 1–37 are completely out of occultation. The CCFs of observations 1–30 are summed in sets of ten and denoted by the solid blue, orange, and green lines. The solid red line shows the combined CCF of observations 31–37. Observations 38–52 contain ingress and full occultation, and the combined CCF for these 15 observations is shown in the dashed black line.
Current usage metrics show cumulative count of Article Views (full-text article views including HTML views, PDF and ePub downloads, according to the available data) and Abstracts Views on Vision4Press platform.
Data correspond to usage on the plateform after 2015. The current usage metrics is available 48-96 hours after online publication and is updated daily on week days.
Initial download of the metrics may take a while.


