Free Access
Fig. 3
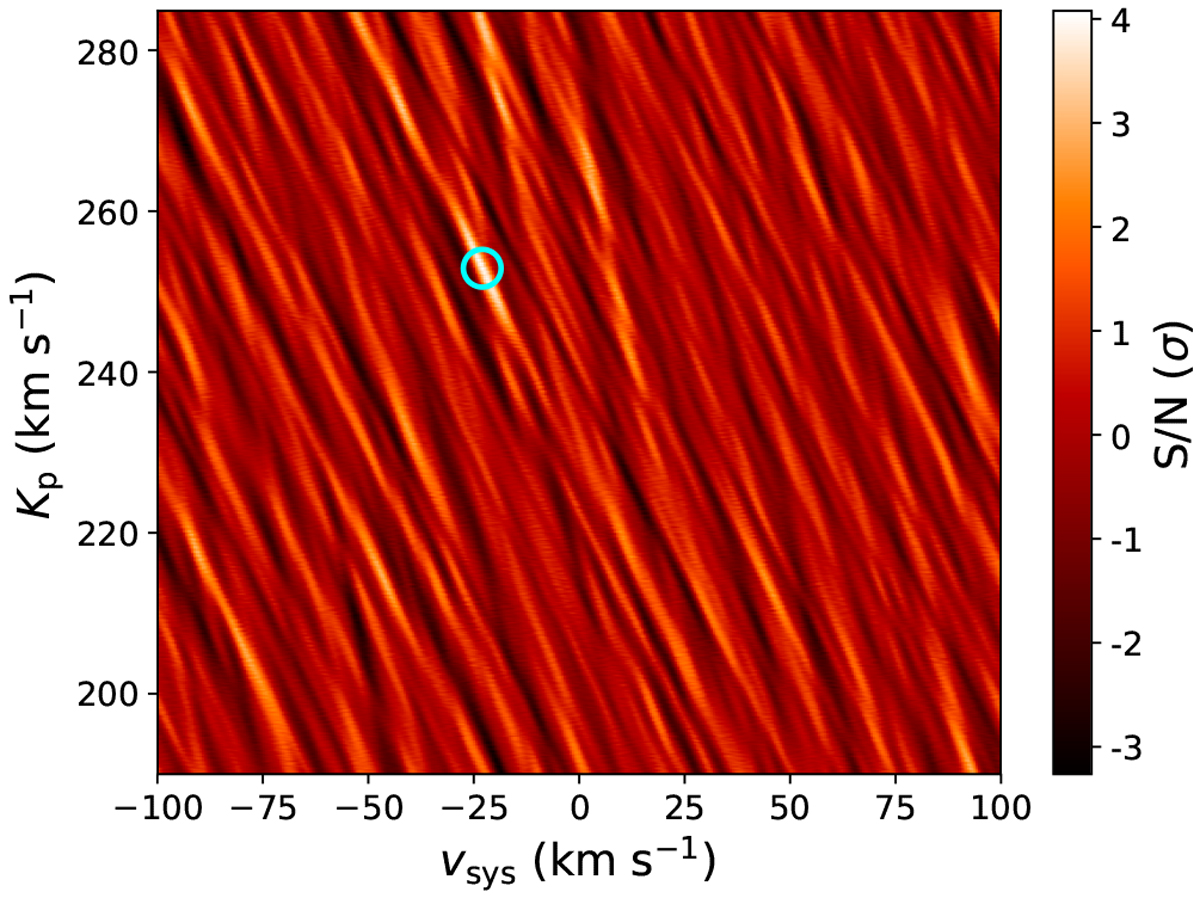
Kp-vsys matrix of S∕N values for the SVD6 data matrix and the ![]() model. For clarity, the vsys-axis is restricted to ±100 km s-1 . The matrix is plotted on the full vsys range in Fig. A.2. The cyan ring indicates the location of the highest S∕N value.
model. For clarity, the vsys-axis is restricted to ±100 km s-1 . The matrix is plotted on the full vsys range in Fig. A.2. The cyan ring indicates the location of the highest S∕N value.
Current usage metrics show cumulative count of Article Views (full-text article views including HTML views, PDF and ePub downloads, according to the available data) and Abstracts Views on Vision4Press platform.
Data correspond to usage on the plateform after 2015. The current usage metrics is available 48-96 hours after online publication and is updated daily on week days.
Initial download of the metrics may take a while.