Fig. 2
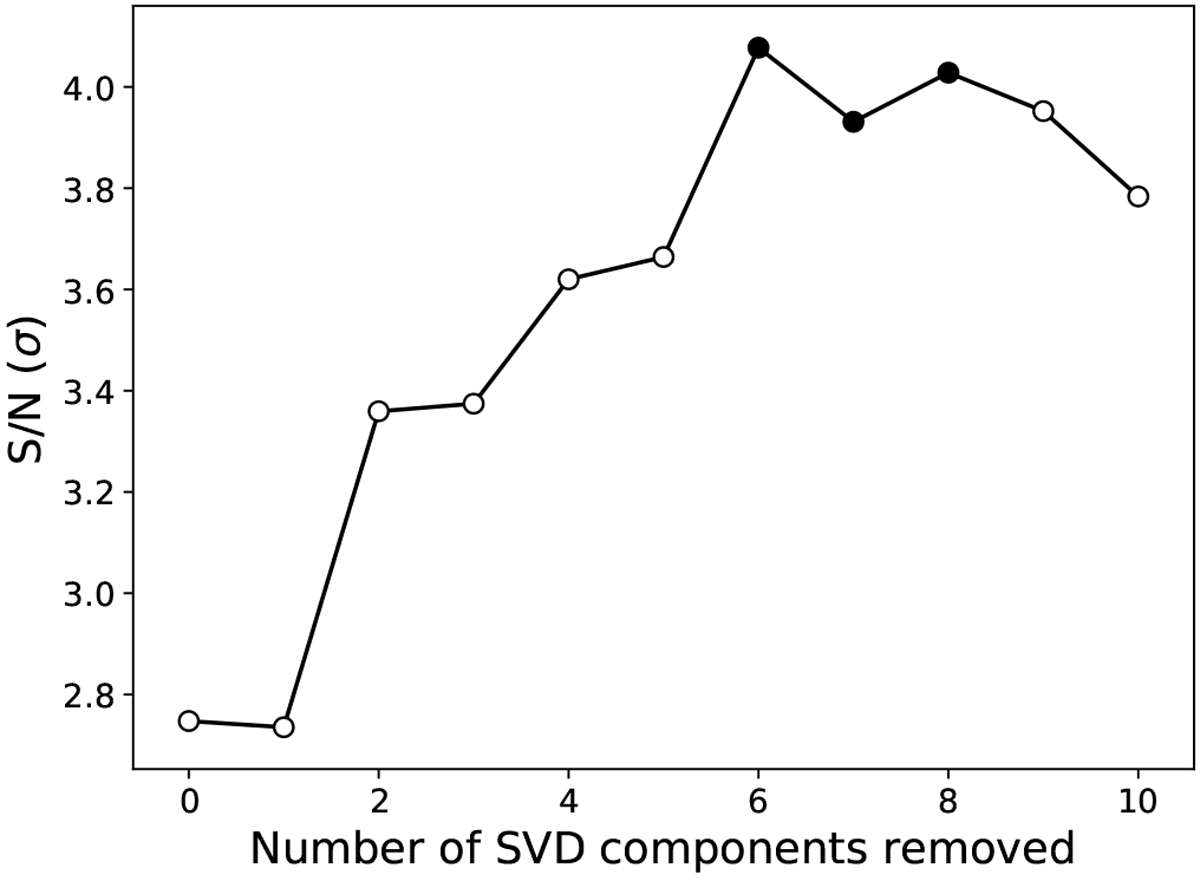
S∕N of the emission peak around ![]() km s−1 in the Kp-vsys matrices for the
km s−1 in the Kp-vsys matrices for the ![]() model and data matrices with various numbers of SVD components removed. The filled circles indicate SVD iterations for which this emission peak is the strongest on the full Kp -vsys matrix. Since the S∕N value exceeds 4σ for SVD iterations 6 and 8, the peak was flagged by our analysis for these iterations.
model and data matrices with various numbers of SVD components removed. The filled circles indicate SVD iterations for which this emission peak is the strongest on the full Kp -vsys matrix. Since the S∕N value exceeds 4σ for SVD iterations 6 and 8, the peak was flagged by our analysis for these iterations.
Current usage metrics show cumulative count of Article Views (full-text article views including HTML views, PDF and ePub downloads, according to the available data) and Abstracts Views on Vision4Press platform.
Data correspond to usage on the plateform after 2015. The current usage metrics is available 48-96 hours after online publication and is updated daily on week days.
Initial download of the metrics may take a while.