Fig. 1
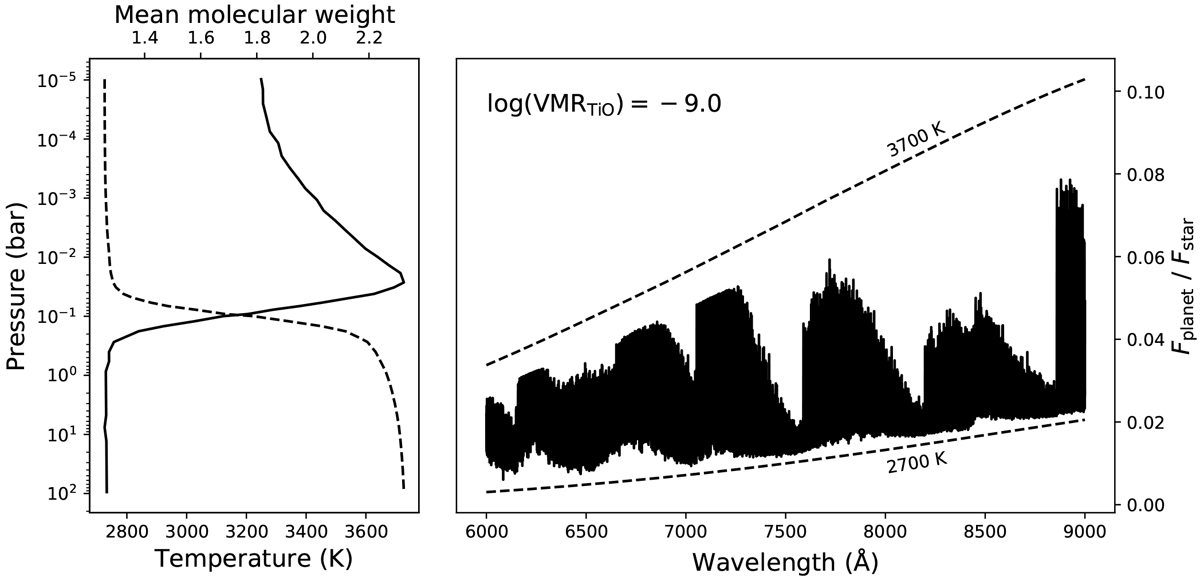
Leftpanel: Haynes et al. (2015) pressure-temperature profile with inversion (solid line) and calculated mean molecular weight profile (dashed line) used to model the TiO emission spectrum of WASP-33b. Right panel: example TiO emission spectrum for WASP-33b assuming a constant
![]() . The planet-to-stellar-continuum flux ratio is plotted (solid line). The dashed lines show the blackbody-to-stellar-continuum flux ratio for the minimum (2700 K) and maximum (3700 K) temperatures of the Haynes et al. (2015) pressure-temperature profile.
. The planet-to-stellar-continuum flux ratio is plotted (solid line). The dashed lines show the blackbody-to-stellar-continuum flux ratio for the minimum (2700 K) and maximum (3700 K) temperatures of the Haynes et al. (2015) pressure-temperature profile.
Current usage metrics show cumulative count of Article Views (full-text article views including HTML views, PDF and ePub downloads, according to the available data) and Abstracts Views on Vision4Press platform.
Data correspond to usage on the plateform after 2015. The current usage metrics is available 48-96 hours after online publication and is updated daily on week days.
Initial download of the metrics may take a while.