Fig. 8
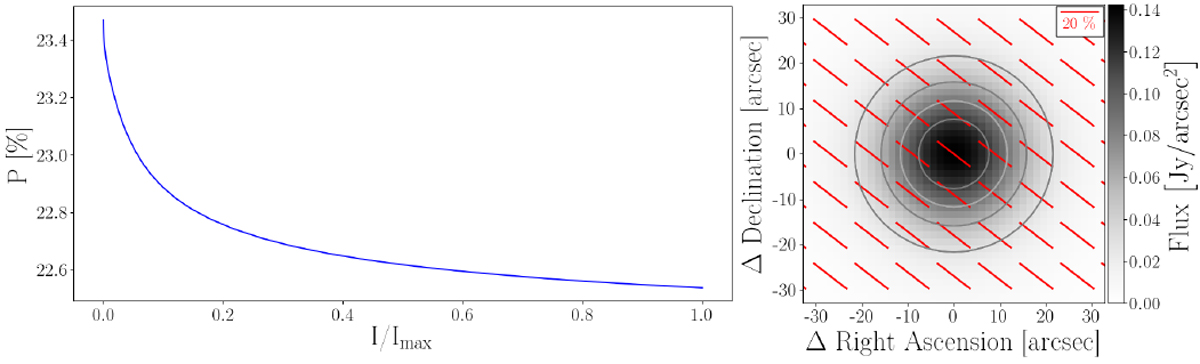
Correlation between polarization degree and normalized intensity (left) and synthetic intensitymap (right) with overlaid polarization vectors for a Bok globule with M = 4.6 M⊙ at λ = 214 μm. Perfectly aligned dust grains are assumed. The isocontour lines mark 20, 40, 60 and 80% of the maximum intensity. The image has been convolved with a Gaussian with the SOFIA/HAWC+ band E FWHM of 18.2″.
Current usage metrics show cumulative count of Article Views (full-text article views including HTML views, PDF and ePub downloads, according to the available data) and Abstracts Views on Vision4Press platform.
Data correspond to usage on the plateform after 2015. The current usage metrics is available 48-96 hours after online publication and is updated daily on week days.
Initial download of the metrics may take a while.