Fig. 10
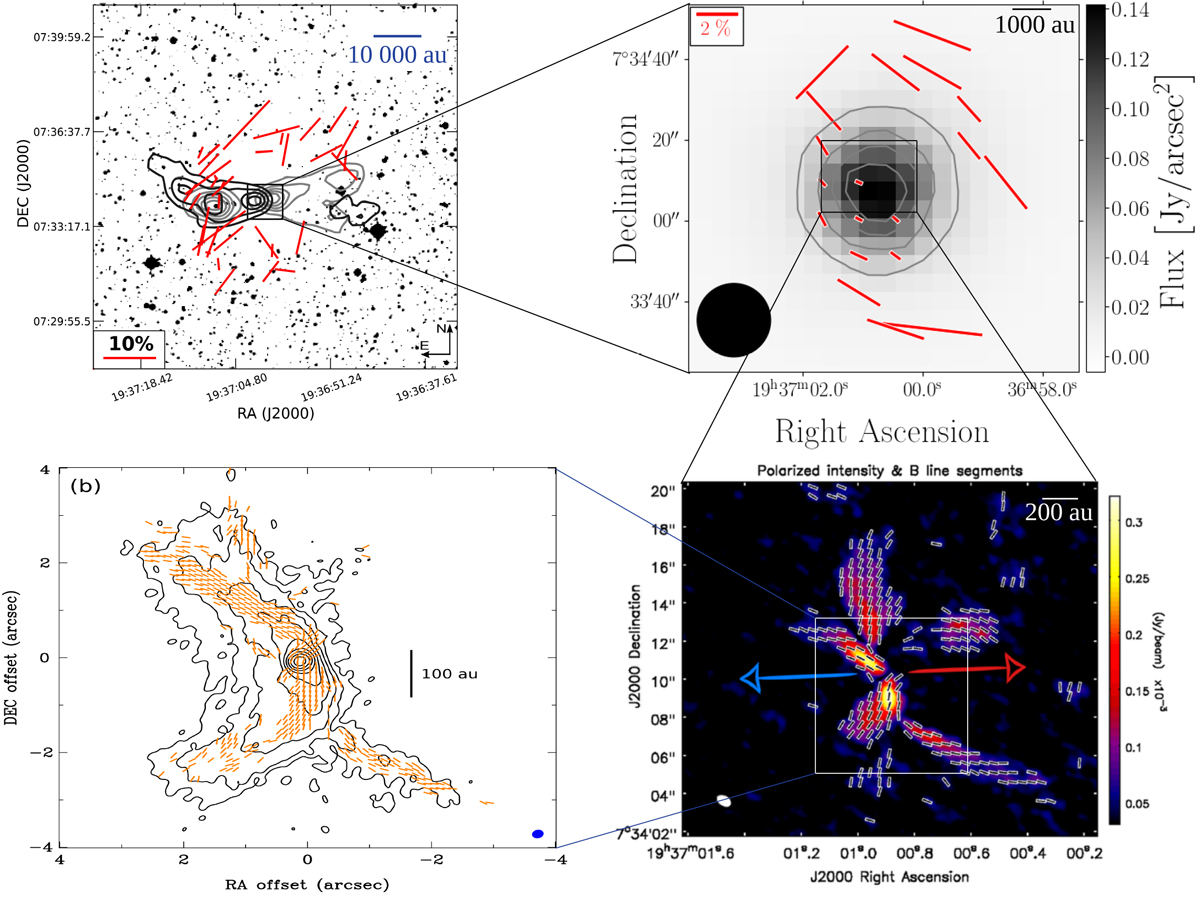
Polarization maps and corresponding magnetic field structure of B335. Top-left: polarization map of B335 in the near-IR (Js band, 1.24 μm, overlaid on a DSS intensity map; Bertrang et al. 2014). Top-right: polarization map of B335 at 214 μm (overlaid on the SOFIA/HAWC+ intensity map; this publication). Bottom-right: polarization map of B335 at 1300 μm (overlaid on the ALMA polarized intensity map; reuse of Fig. 1 in Maury et al. 2018). Shown is the derived magnetic field direction. The arrows indicate the outflow direction. Bottom-left: polarization map of B335 at 870 μm (overlaid on the ALMA contour map; Yen et al. 2020, ©AAS. Reproduced with permission). Shown is the derived magnetic field direction.
Current usage metrics show cumulative count of Article Views (full-text article views including HTML views, PDF and ePub downloads, according to the available data) and Abstracts Views on Vision4Press platform.
Data correspond to usage on the plateform after 2015. The current usage metrics is available 48-96 hours after online publication and is updated daily on week days.
Initial download of the metrics may take a while.