Fig. 3.
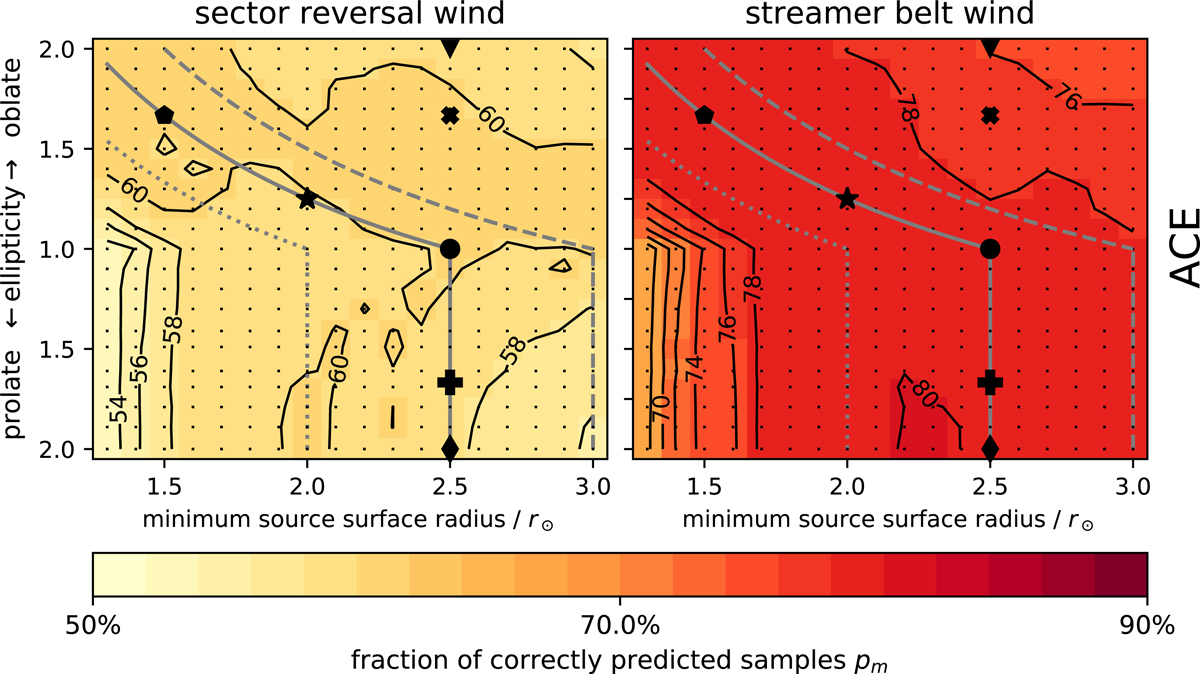
Back mapping polarity measure for streamer belt and sector reversal wind. Ballistic back mapping was performed from ACE to the source surface during period 1 (CR2041−CR2055, 2006, declining solar activity). The colored pixels give the value at their center positions (black dots) in 2% increments. A contour plot bi-linearly interpolating between these values has been drawn on top. Lines marking model parameters of constant equatorial source surface height have been inserted for rss, equ = 2.5 R⊙ (solid gray line), for rss, equ = 2.0 R⊙ (dotted gray line), and for rss, equ = 3.0 R⊙ (dashed gray line). The black symbols mark the parameters for the example source surfaces from Fig. 1.
Current usage metrics show cumulative count of Article Views (full-text article views including HTML views, PDF and ePub downloads, according to the available data) and Abstracts Views on Vision4Press platform.
Data correspond to usage on the plateform after 2015. The current usage metrics is available 48-96 hours after online publication and is updated daily on week days.
Initial download of the metrics may take a while.