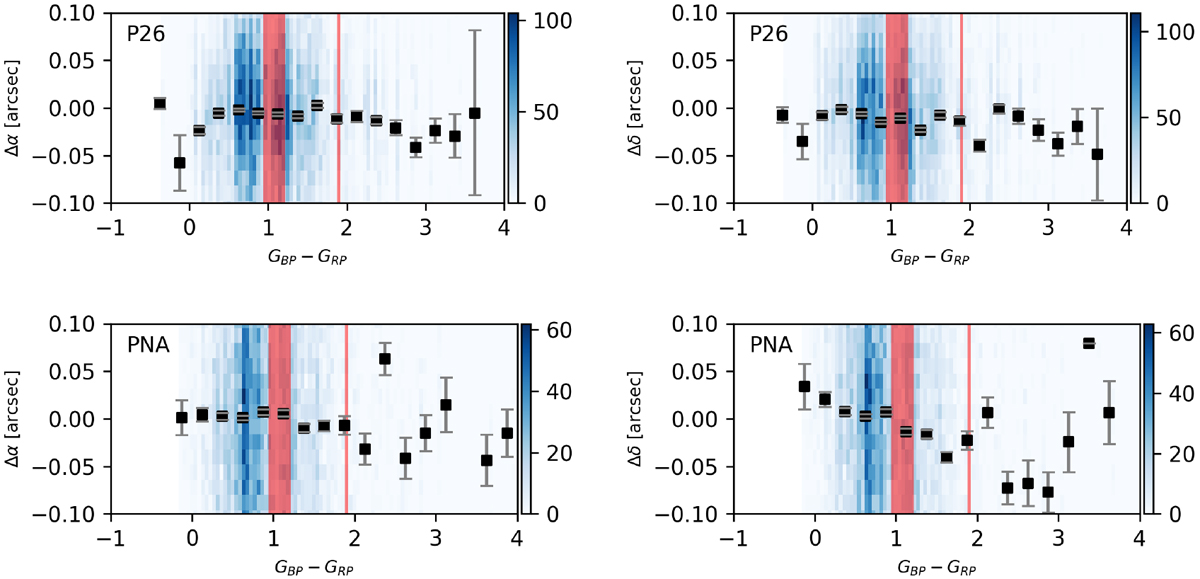
Fig. 9

Residuals for the Gaia stars as a function of color indices for the P26 and PNA satellite location areas. Red semi-transparent spans show the color indices of the main Saturnian satellites (the thin band at the GBP − GRP ≈ 1.9 mag represents Titan’s color). The (B–V) values for the Saturnian satellites were taken from Cruikshank (1978). They were converted to the Gaia color system according to Jordi et al. (2010). Color maps show the distribution of the differences over the color. Blue represents the number of differences in each bin, as indicated by the color bar.
Current usage metrics show cumulative count of Article Views (full-text article views including HTML views, PDF and ePub downloads, according to the available data) and Abstracts Views on Vision4Press platform.
Data correspond to usage on the plateform after 2015. The current usage metrics is available 48-96 hours after online publication and is updated daily on week days.
Initial download of the metrics may take a while.


