Fig. 8
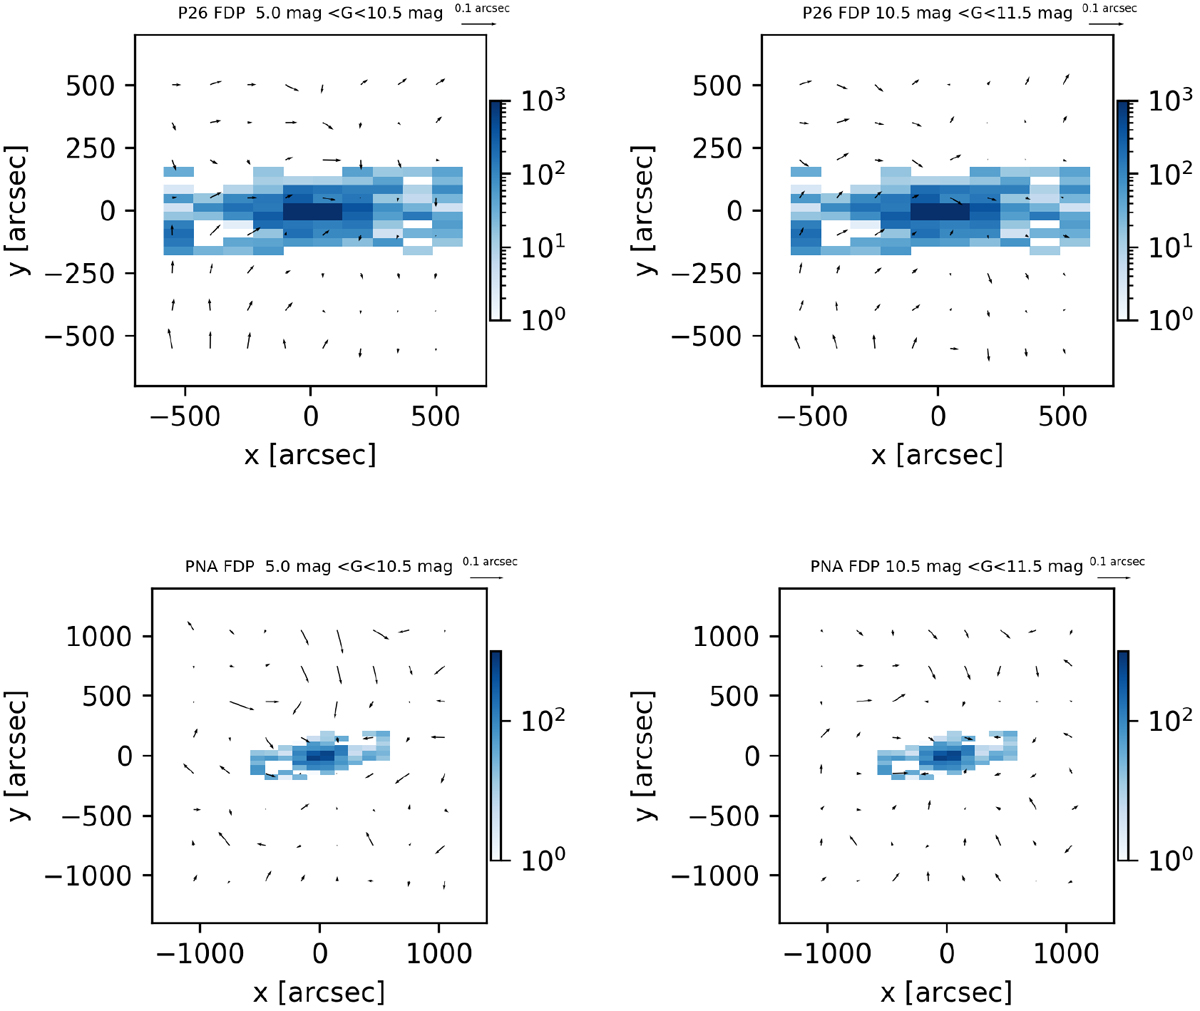
Field distortion patterns for the P26 and PNA in different magnitude intervals. Each vector is an average of more than 100 separate residuals. Colored areas show the distribution of the satellite positions over the photographic plate. Color bars show the number of satellite images in a corresponding location. Top and bottom diagrams: results from the P26 and PNA, respectively, for bright (left) and faint (right) stars.
Current usage metrics show cumulative count of Article Views (full-text article views including HTML views, PDF and ePub downloads, according to the available data) and Abstracts Views on Vision4Press platform.
Data correspond to usage on the plateform after 2015. The current usage metrics is available 48-96 hours after online publication and is updated daily on week days.
Initial download of the metrics may take a while.