Fig. 8.
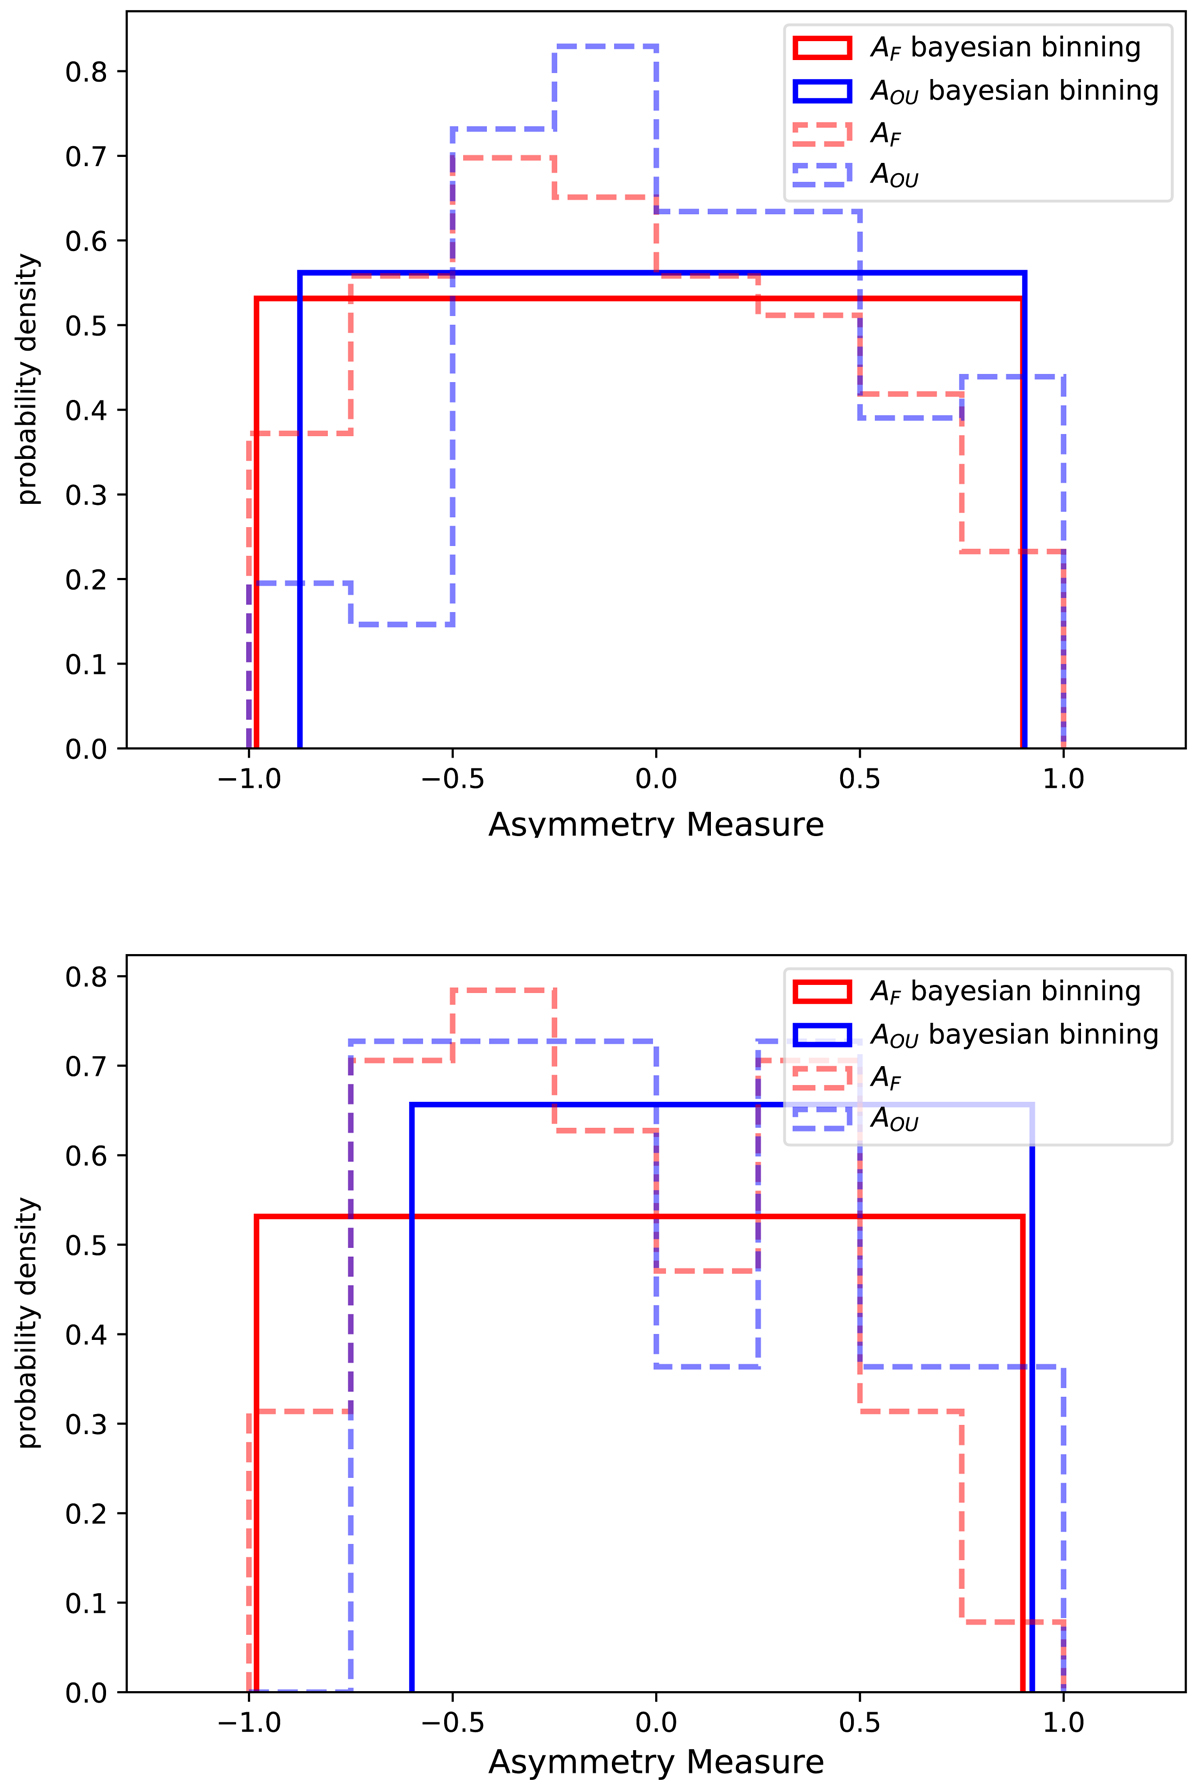
Asymmetry measures for the observed LAT LCs compared to a subset of synthetic OU LCs. The bins are set by the Bayesian block algorithm. The dashed and transparent bins are set to 0.25 and are plotted for convenience to show a “classical” histogram. The Bayesian binning shows that the asymmetry measures for both data sets basically are present in a range between (−1,1) with the same probability. Top: three- block HOP group omitted; bottom: four-block HOP groups omitted.
Current usage metrics show cumulative count of Article Views (full-text article views including HTML views, PDF and ePub downloads, according to the available data) and Abstracts Views on Vision4Press platform.
Data correspond to usage on the plateform after 2015. The current usage metrics is available 48-96 hours after online publication and is updated daily on week days.
Initial download of the metrics may take a while.