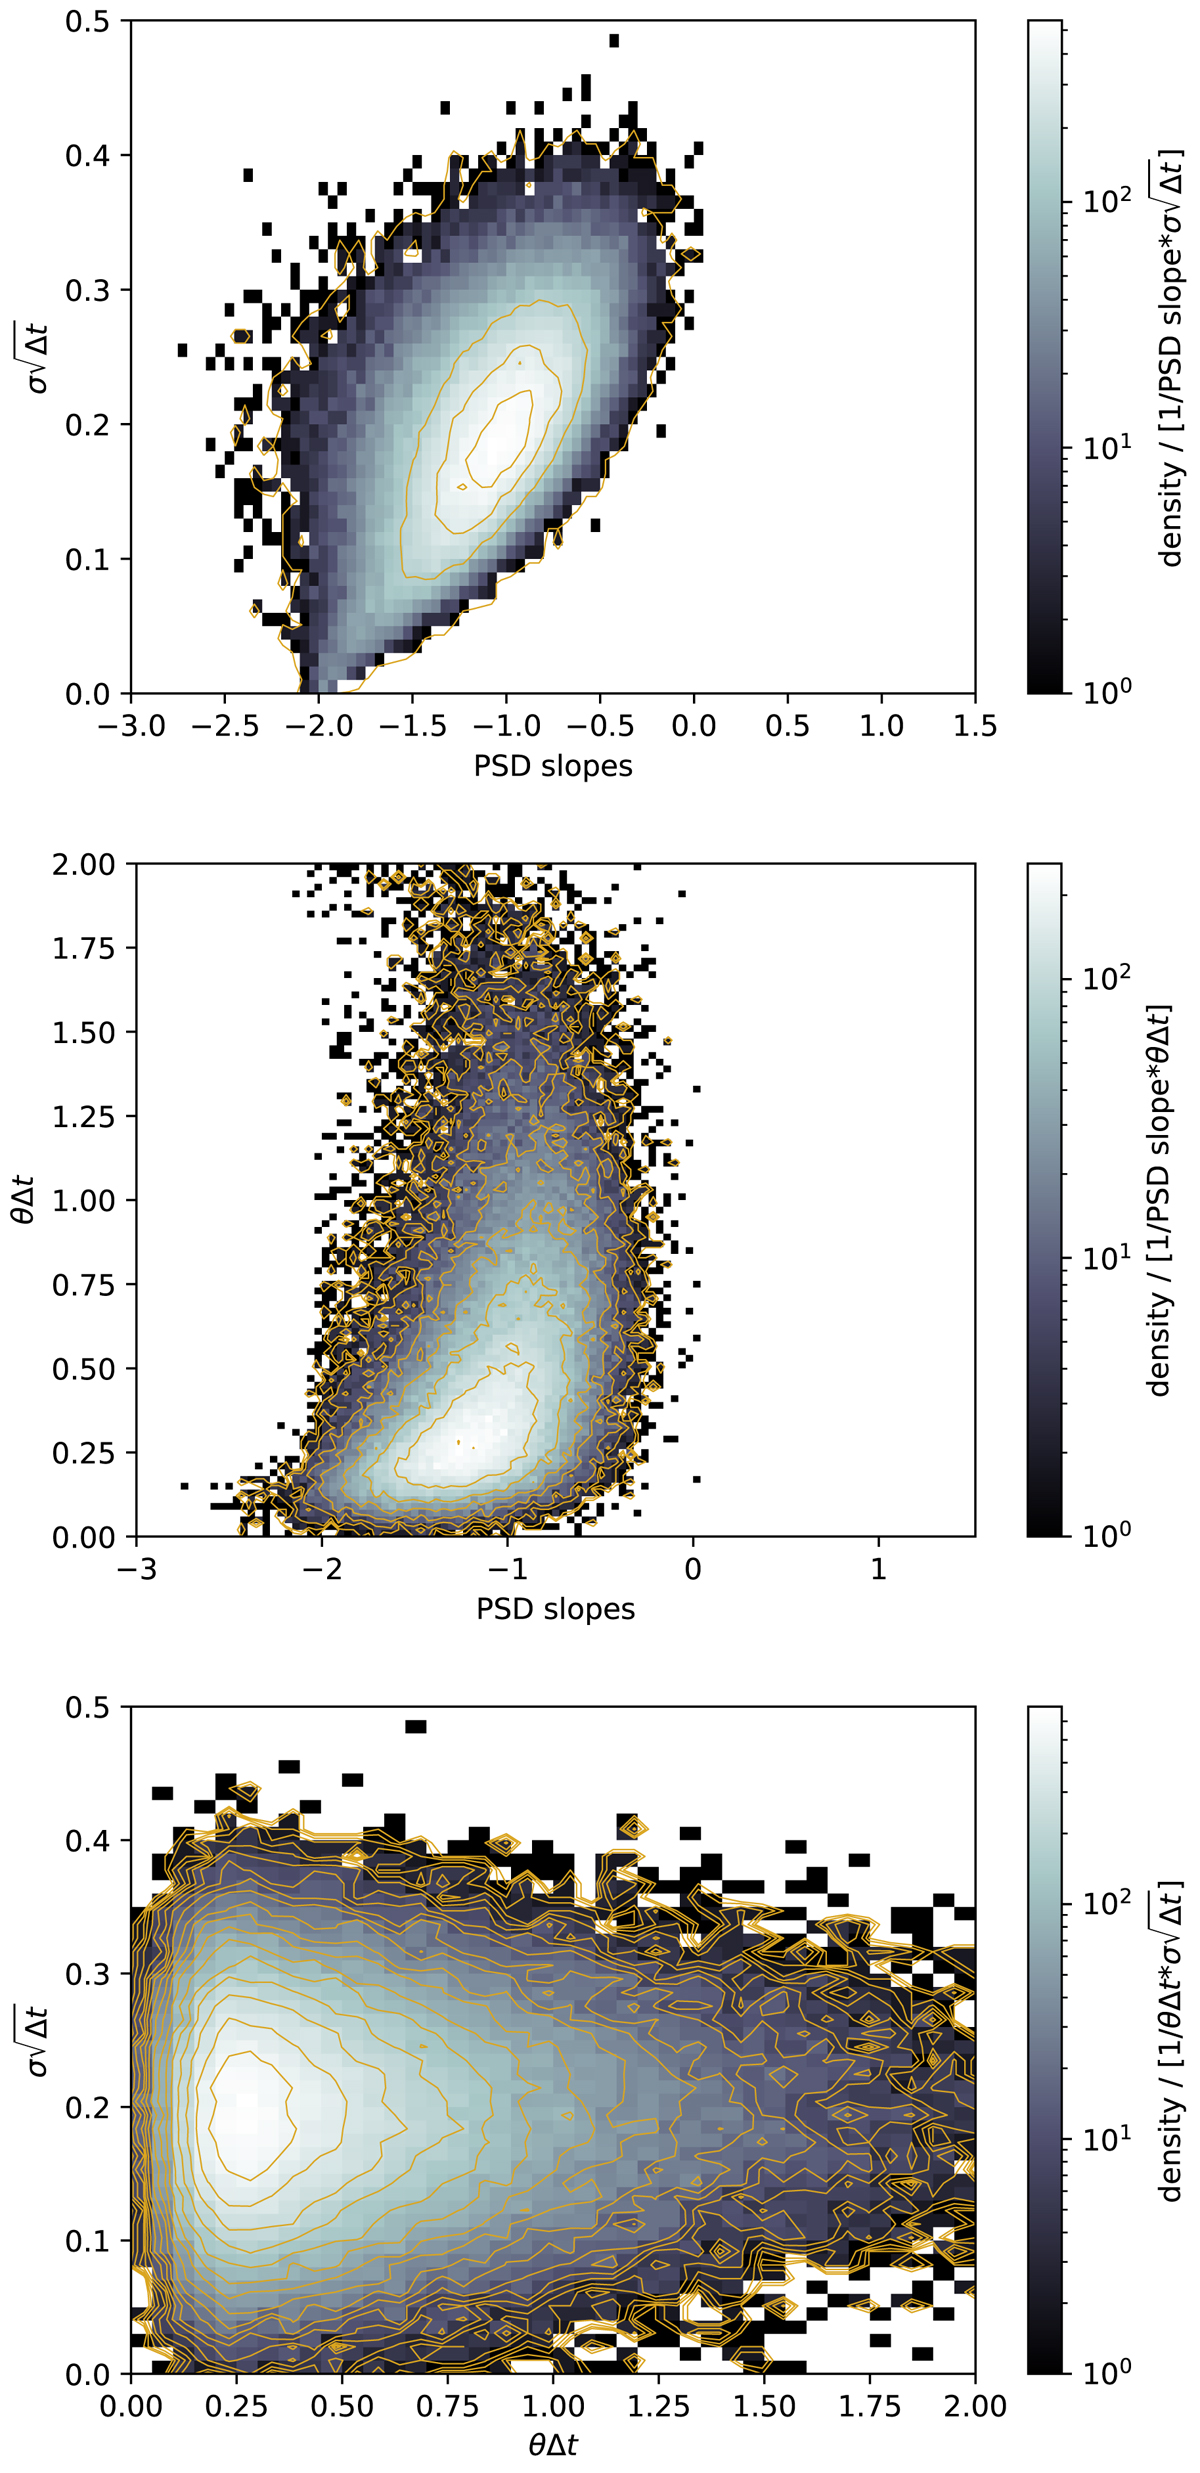
Fig. 7.

2D histograms illustrating the impact of the OU parameters σ and θ on the PSD slopes. The parameters are set in the simulation for each LC and are obtained from the number generators, as discussed in Sect. 4.6. The density plots are over plotted with contours, spanning the domain of the color scales and are all separated by a factor of ![]() . Top: σ determines the impact of the white noise term in Eq. (5e). The larger the parameter, the flatter becomes the slope of the PSD. This relation however is not linear (which would be seen as a narrow ellipse) because if θ is small at the same time when σ is large, the white noise terms counteract the effect of θ. Therefore the distribution has a bulky shape. The contour lanes emphasize the tendency of this direct relation between σ and the PSD slope, as seen in the ellipses where the data density is the highest. The contour lanes cover a region of [1, 1000]/[1/PSD slope * θΔt]. In the region where the distribution becomes bulky −2.5 ≲ PSD slope ≲ −1.5 the effect of σ vs. θ counteraction can be seen. Mid: value of θ also impacts the PSD slope directly. For θ → 1 this however breaks since in this case the only terms left in Eq. (5e) are the white noise terms, where the σ parameters takes over. The contour lines in this case also suggest a direct proportionality between θ and PSD slopes for θ < 0.6. The contours cover a range of [1, 1000]/[1/PSD slope * θΔt]. Bottom: Relation between θ and σ showing that these values are uncorrelated, however there is a asymmetry in the distribution (positive skewness) where θ → 1 where in Eq. (5e) only the white noise terms are left. This skewness explains the crowding of the distributions above. The contours cover a range of
. Top: σ determines the impact of the white noise term in Eq. (5e). The larger the parameter, the flatter becomes the slope of the PSD. This relation however is not linear (which would be seen as a narrow ellipse) because if θ is small at the same time when σ is large, the white noise terms counteract the effect of θ. Therefore the distribution has a bulky shape. The contour lanes emphasize the tendency of this direct relation between σ and the PSD slope, as seen in the ellipses where the data density is the highest. The contour lanes cover a region of [1, 1000]/[1/PSD slope * θΔt]. In the region where the distribution becomes bulky −2.5 ≲ PSD slope ≲ −1.5 the effect of σ vs. θ counteraction can be seen. Mid: value of θ also impacts the PSD slope directly. For θ → 1 this however breaks since in this case the only terms left in Eq. (5e) are the white noise terms, where the σ parameters takes over. The contour lines in this case also suggest a direct proportionality between θ and PSD slopes for θ < 0.6. The contours cover a range of [1, 1000]/[1/PSD slope * θΔt]. Bottom: Relation between θ and σ showing that these values are uncorrelated, however there is a asymmetry in the distribution (positive skewness) where θ → 1 where in Eq. (5e) only the white noise terms are left. This skewness explains the crowding of the distributions above. The contours cover a range of ![]() .
.
Current usage metrics show cumulative count of Article Views (full-text article views including HTML views, PDF and ePub downloads, according to the available data) and Abstracts Views on Vision4Press platform.
Data correspond to usage on the plateform after 2015. The current usage metrics is available 48-96 hours after online publication and is updated daily on week days.
Initial download of the metrics may take a while.


