Fig. 6.
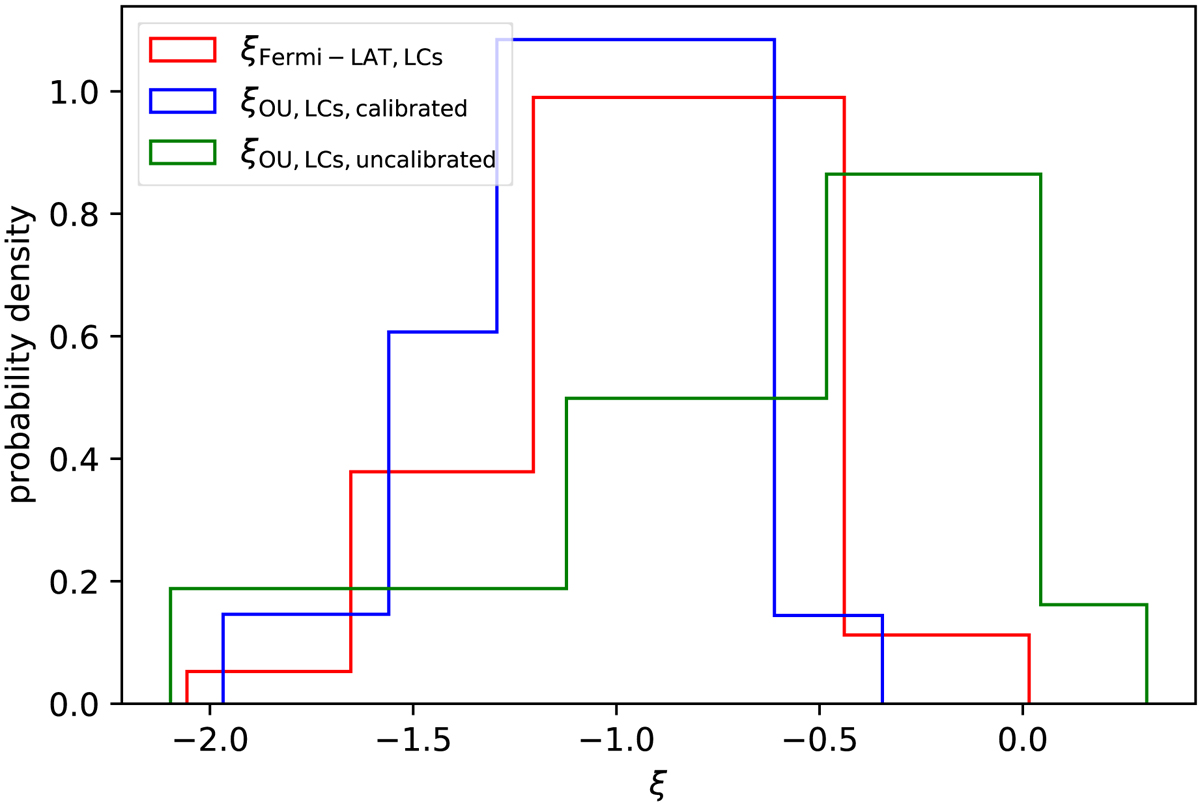
PSD slope distribution for different data sets. The green histogram represents the ξ distribution for the test OU light curves (parameters are drawn from Gaussian distributions) used to test of the extraction method. The red histogram represents the ξ distribution of the observed Fermi-LAT data. The blue ξ distribution represents the OU LCs where the OU parameters are calibrated with the observed data. The bins are determined with the Bayesian block algorithm (Scargle et al. 2013).
Current usage metrics show cumulative count of Article Views (full-text article views including HTML views, PDF and ePub downloads, according to the available data) and Abstracts Views on Vision4Press platform.
Data correspond to usage on the plateform after 2015. The current usage metrics is available 48-96 hours after online publication and is updated daily on week days.
Initial download of the metrics may take a while.