Fig. 3.
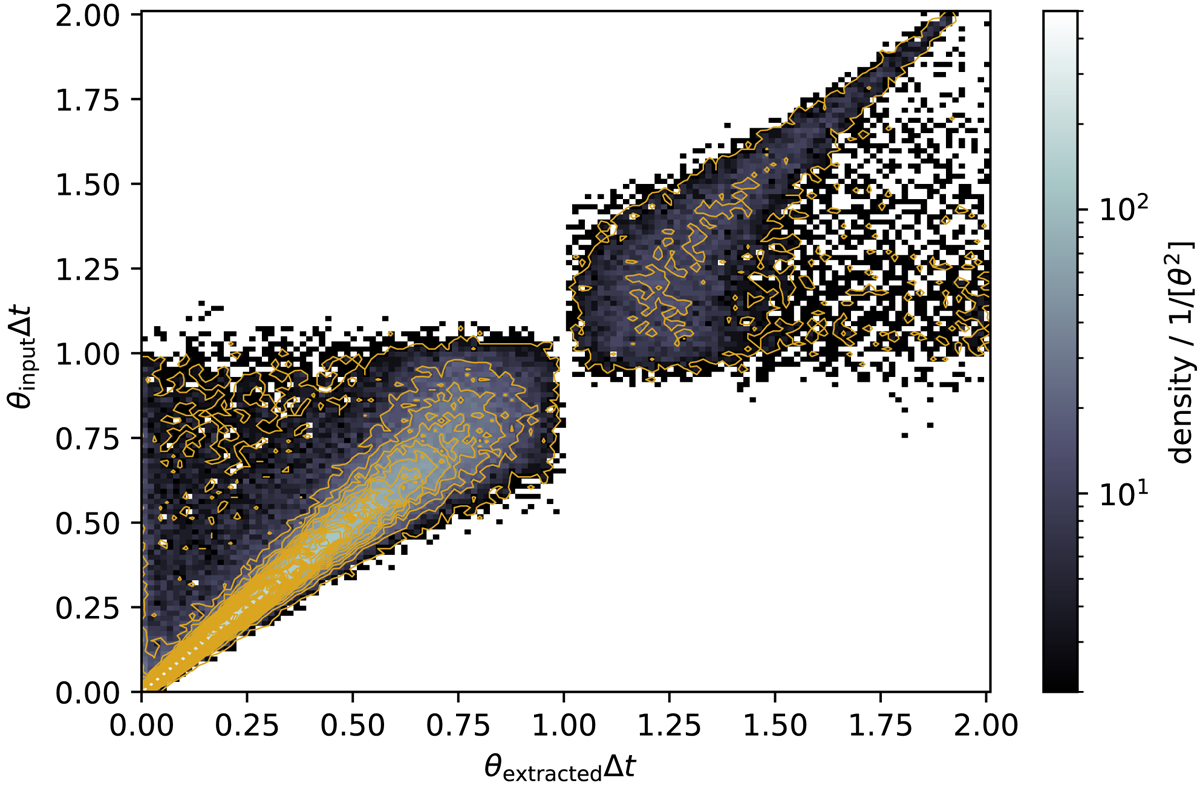
Inserted and extracted θ show a correlation for θ values far from one. This can be understood in the following way. If θ = 1 then the reversion rate in Eq. (5e) cancels leaving only the white noise term. In the case of white noise the approximation in Sect. 4.3 does not hold and the method breaks. The contour lines cover a range of [2500]/[σΔt] and are separated by 48.9.
Current usage metrics show cumulative count of Article Views (full-text article views including HTML views, PDF and ePub downloads, according to the available data) and Abstracts Views on Vision4Press platform.
Data correspond to usage on the plateform after 2015. The current usage metrics is available 48-96 hours after online publication and is updated daily on week days.
Initial download of the metrics may take a while.