Fig. 1.
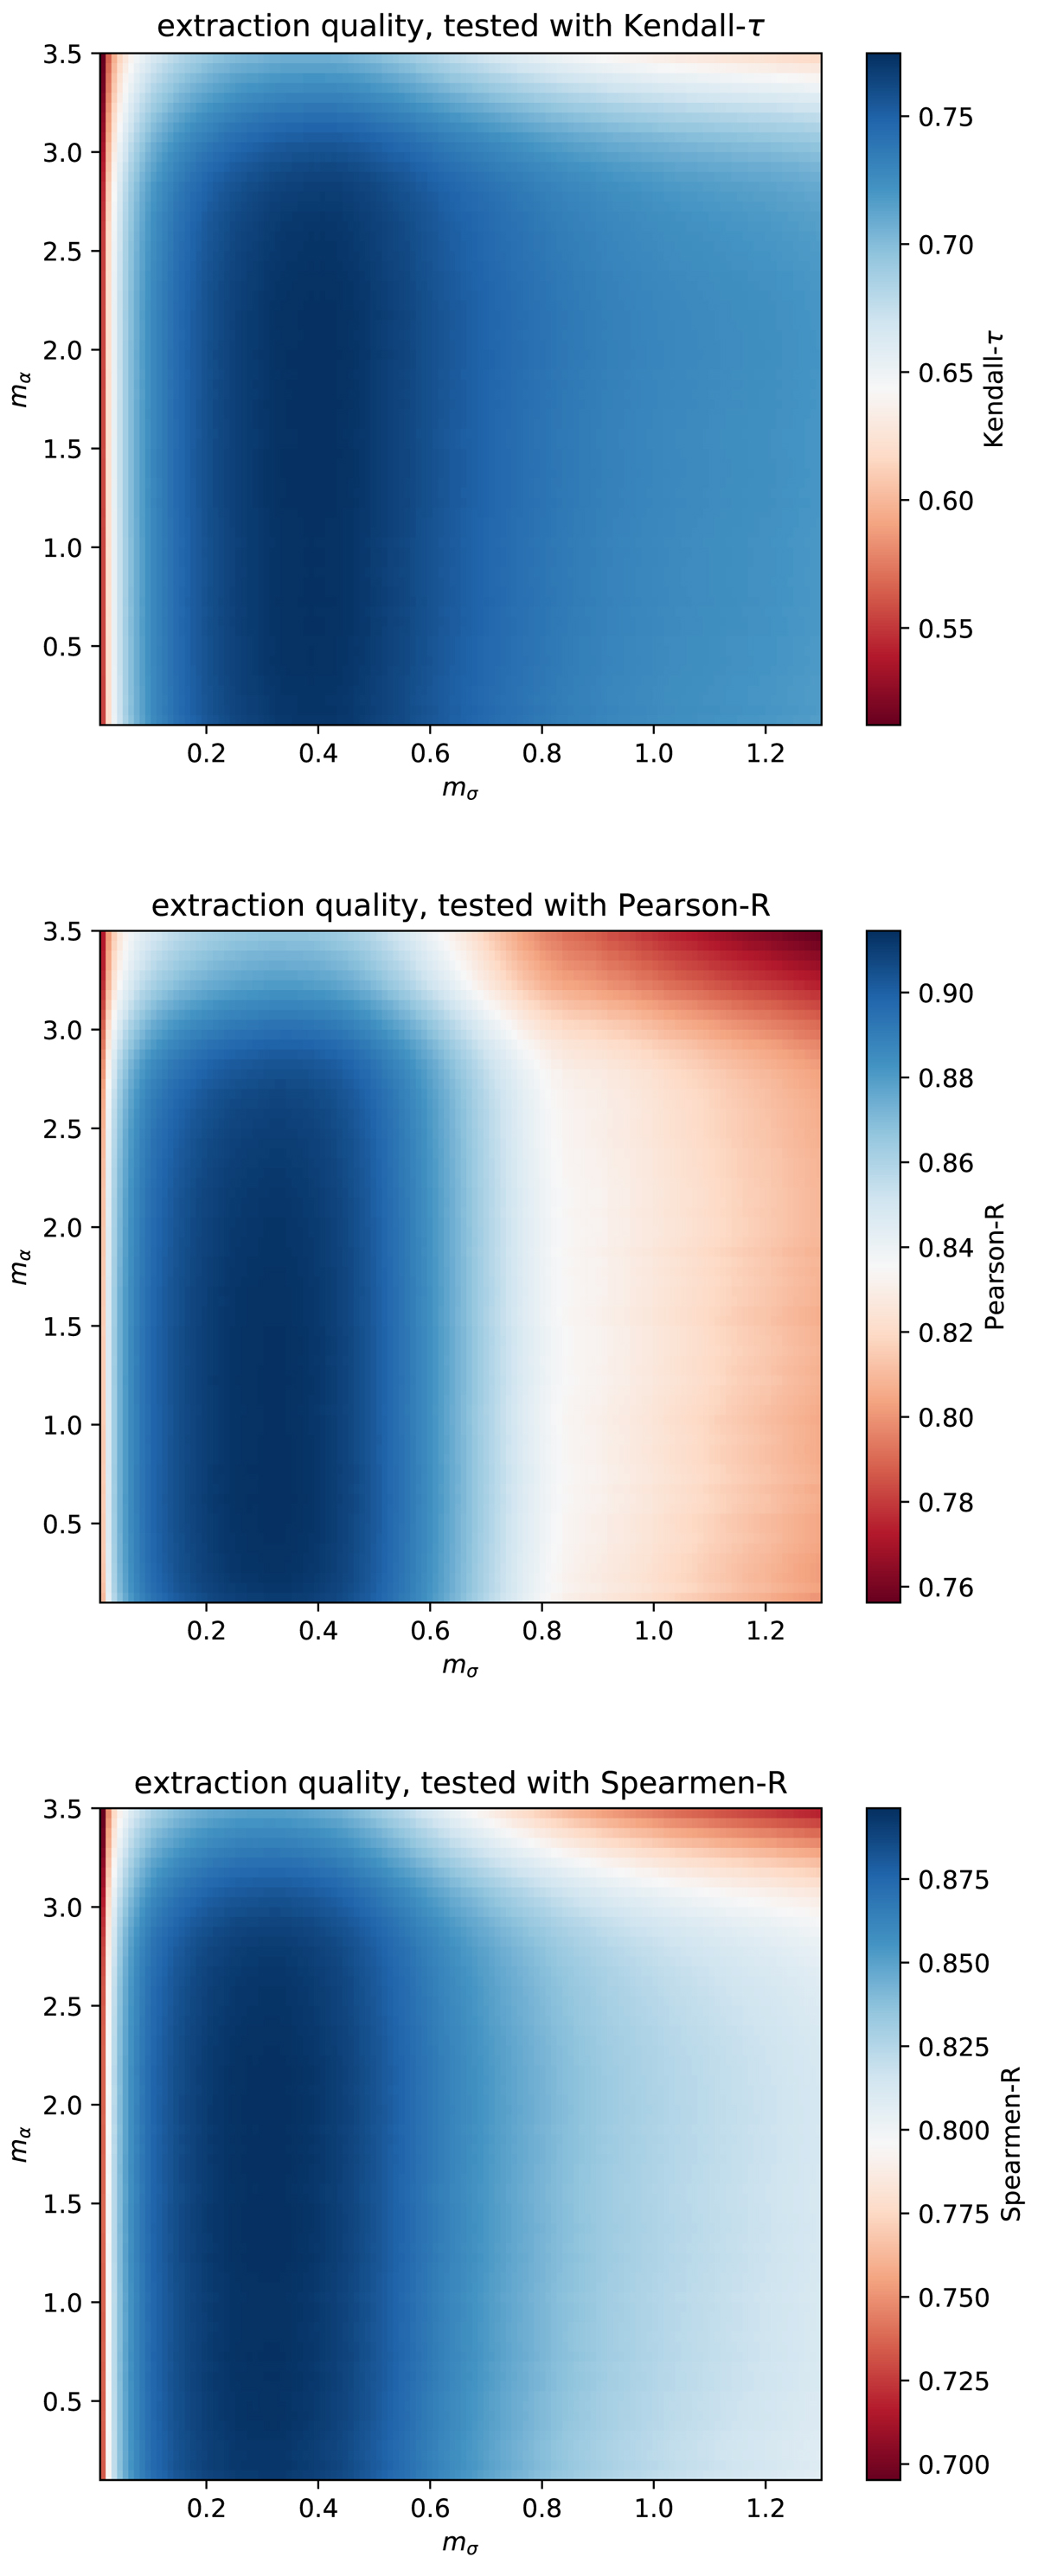
Color code shows rank correlation coefficients τKendall (top), RPearson (mid) and RSpearman (bottom) between known input and extracted output OU parameters σ and θ of the generic OU time series for different values of mσ vs. mα, that is basically ϵσ vs. ϵα. The blue regions define values of ϵσ and ϵα that yield robust results for the extraction method. An analysis of the maximum valued for each rank correlation index yields environments of ϵσ = 0.343 ± 0.0036 and ϵθ = 1.48 ± 0.36.
Current usage metrics show cumulative count of Article Views (full-text article views including HTML views, PDF and ePub downloads, according to the available data) and Abstracts Views on Vision4Press platform.
Data correspond to usage on the plateform after 2015. The current usage metrics is available 48-96 hours after online publication and is updated daily on week days.
Initial download of the metrics may take a while.