Free Access
Fig. 6.
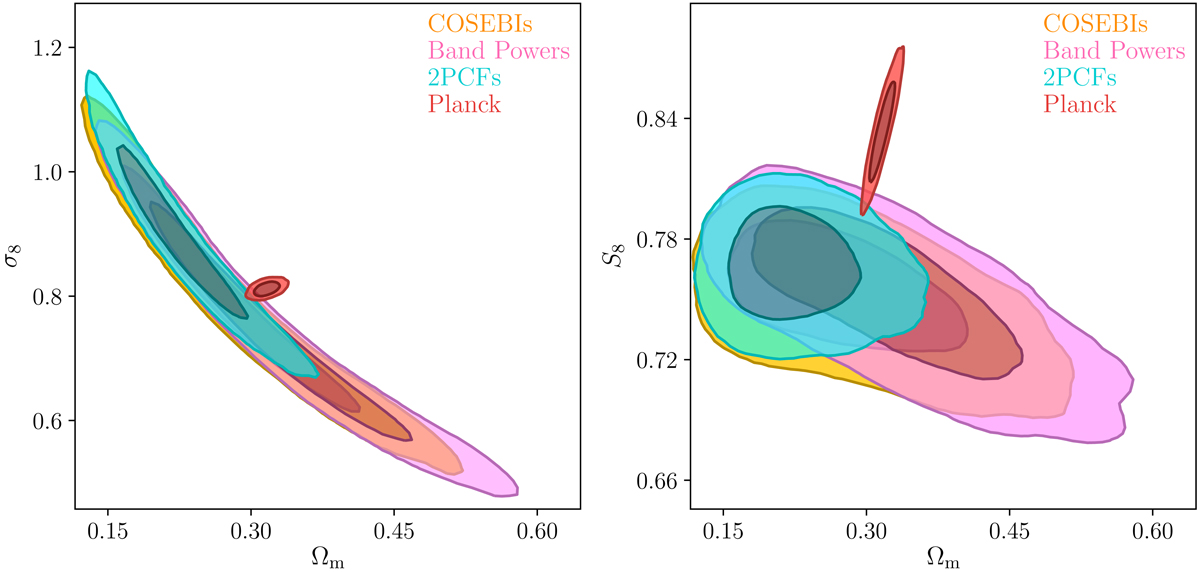
Marginalised constraints for the joint distributions of σ8 and Ωm (left), as well as S8 and Ωm (right). The 68% and 95% credible regions are shown for COSEBIs (orange), band powers (pink) and the 2PCFs (cyan). Planck (2018, TT, TE, EE+lowE) results are shown in red.
Current usage metrics show cumulative count of Article Views (full-text article views including HTML views, PDF and ePub downloads, according to the available data) and Abstracts Views on Vision4Press platform.
Data correspond to usage on the plateform after 2015. The current usage metrics is available 48-96 hours after online publication and is updated daily on week days.
Initial download of the metrics may take a while.