Fig. B.1.
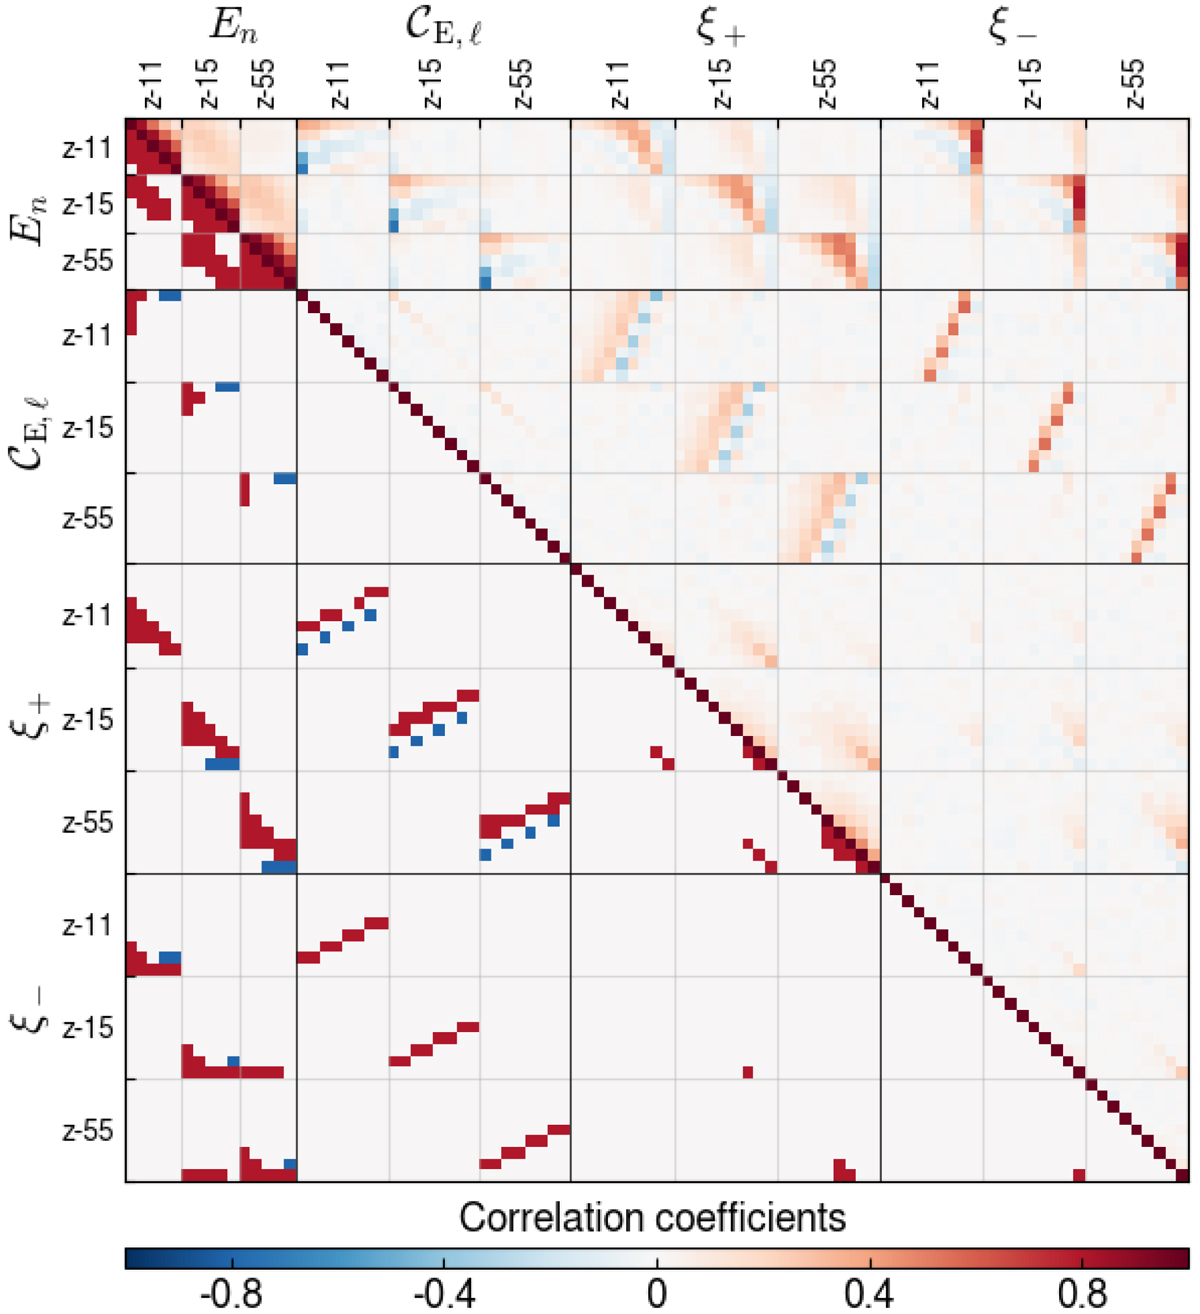
Cross-correlation matrix between COSEBIs (En), band powers (𝒞E,l) and 2PCFs (ξ±) from SALMO mocks. The top triangle shows the cross-correlation values corresponding to the colour-bar. The bottom triangle highlights the entries with more than 20% (red) or less than −20% (blue) correlation. We show results for tomographic bin combinations of the lowest and highest redshift bins only, resulting in three blocks per statistic containing the bin combinations 1–1, 1–5, and 5–5.
Current usage metrics show cumulative count of Article Views (full-text article views including HTML views, PDF and ePub downloads, according to the available data) and Abstracts Views on Vision4Press platform.
Data correspond to usage on the plateform after 2015. The current usage metrics is available 48-96 hours after online publication and is updated daily on week days.
Initial download of the metrics may take a while.