Fig. A.2.
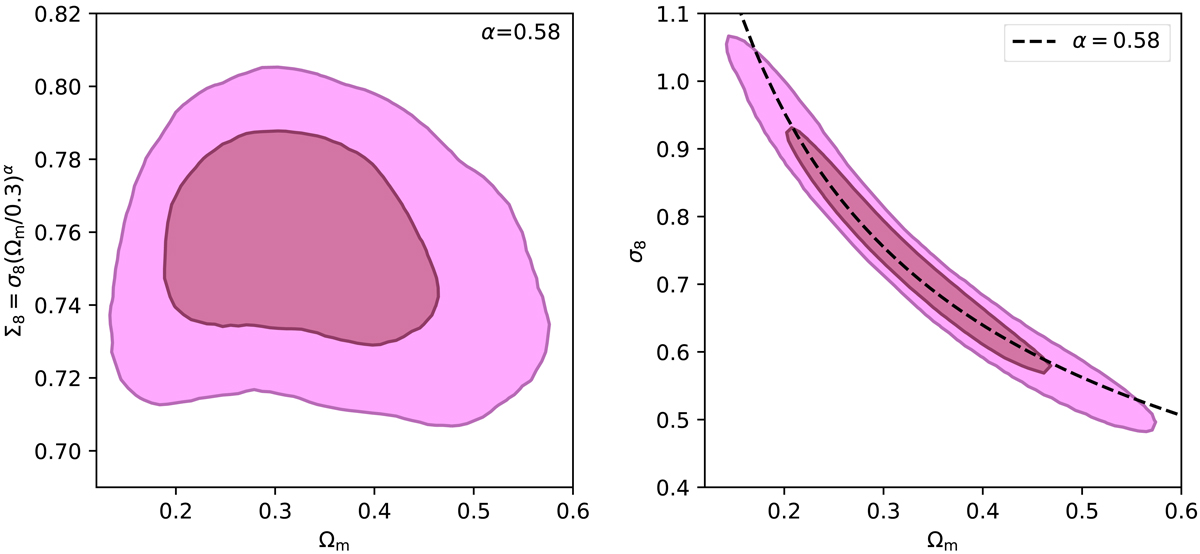
The best-fitting curve of the form σ8 = Σ8(Ωm/0.3)−α and its resulting Σ8. Here we demonstrate the fitting method using band powers. The dashed curve in the right-hand panel shows the best-fitting function to all samples in the σ8 and Ωm plane for which we find α = 0.58. The left-hand panel shows the resulting marginal Σ8 posterior against Ωm.
Current usage metrics show cumulative count of Article Views (full-text article views including HTML views, PDF and ePub downloads, according to the available data) and Abstracts Views on Vision4Press platform.
Data correspond to usage on the plateform after 2015. The current usage metrics is available 48-96 hours after online publication and is updated daily on week days.
Initial download of the metrics may take a while.