Fig. 6.
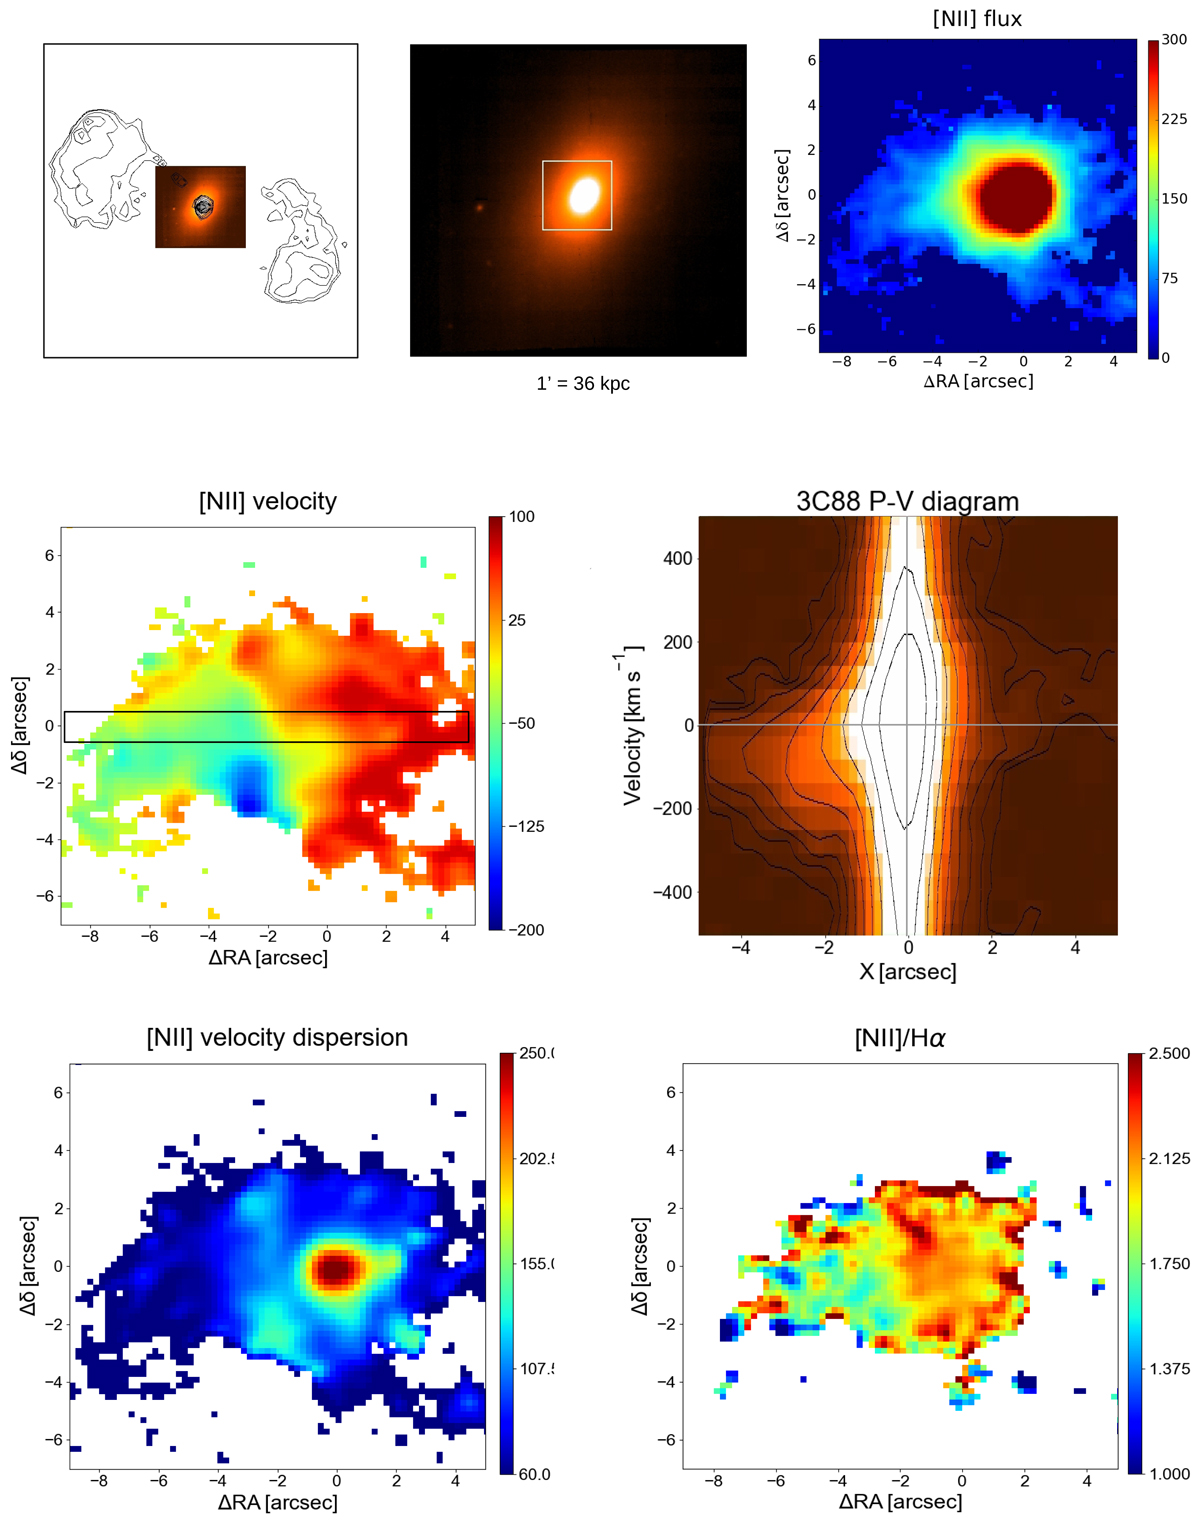
3C 088: FR II/LEG, 1″ = 0.60 kpc. Top left: radio contours (black) overlaid onto the MUSE continuum. The size of the image is the whole MUSE field of view, 1′ × 1′. Top center: MUSE continuum image with superposed the region in which we explored the emission line properties (white square). Top right: [N II] emission line image extracted from the white square in the center panel. Surface brightness is 10−18 erg s−1 cm−2 arcsec−2. Central panels: (left) velocity field (in km s−1) from the [N II] line; (right) position–velocity diagram extracted from the synthetic aperture shown in the left panel (width 0![]() 6, PA = 90°). Bottom panels (left): velocity dispersion distribution and (right) [N II]/Hα map.
6, PA = 90°). Bottom panels (left): velocity dispersion distribution and (right) [N II]/Hα map.
Current usage metrics show cumulative count of Article Views (full-text article views including HTML views, PDF and ePub downloads, according to the available data) and Abstracts Views on Vision4Press platform.
Data correspond to usage on the plateform after 2015. The current usage metrics is available 48-96 hours after online publication and is updated daily on week days.
Initial download of the metrics may take a while.