Fig. 7.
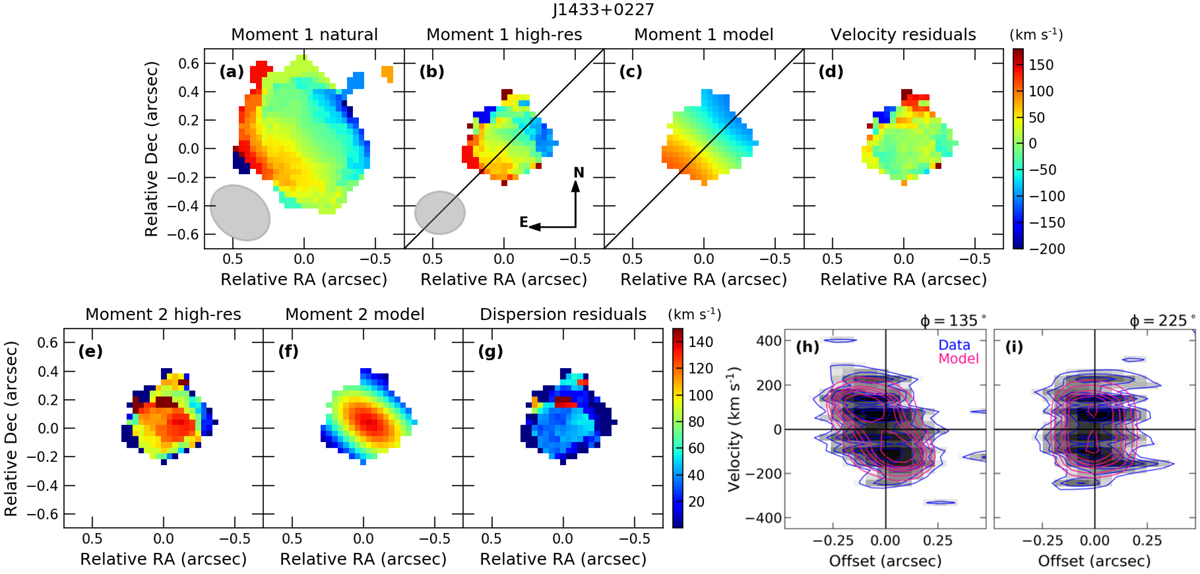
Velocity maps of J1433+0227 associated with CO(4−3) emission detected at > 3σ40 km s−1 significance in the original (a) and high-resolution (b) maps, in which σ40 km s−1 = 0.43 mJy beam−1 and 0.71 mJy beam−1, respectively. ALMA beams are shown by the grey ellipses. Panel c: velocity map for the best-fit BAROLO model of a rotating disk. Black line indicates the major kinematic axis of the model. Velocity residuals are shown in panel d. Panels e–g: velocity dispersion maps associated with the high-resolution ALMA data and the best-fit BAROLO model, and the dispersion residual map. Position-velocity diagram associated with the high-resolution datacube along major (h) and minor (i) kinematic axes are also shown. Top labels indicate the associated position angles (measured anti-clockwise from north). Blue contours refer to the [2,3,4,5,6,8, …]σ40 km s−1 significance.
Current usage metrics show cumulative count of Article Views (full-text article views including HTML views, PDF and ePub downloads, according to the available data) and Abstracts Views on Vision4Press platform.
Data correspond to usage on the plateform after 2015. The current usage metrics is available 48-96 hours after online publication and is updated daily on week days.
Initial download of the metrics may take a while.