Fig. 6.
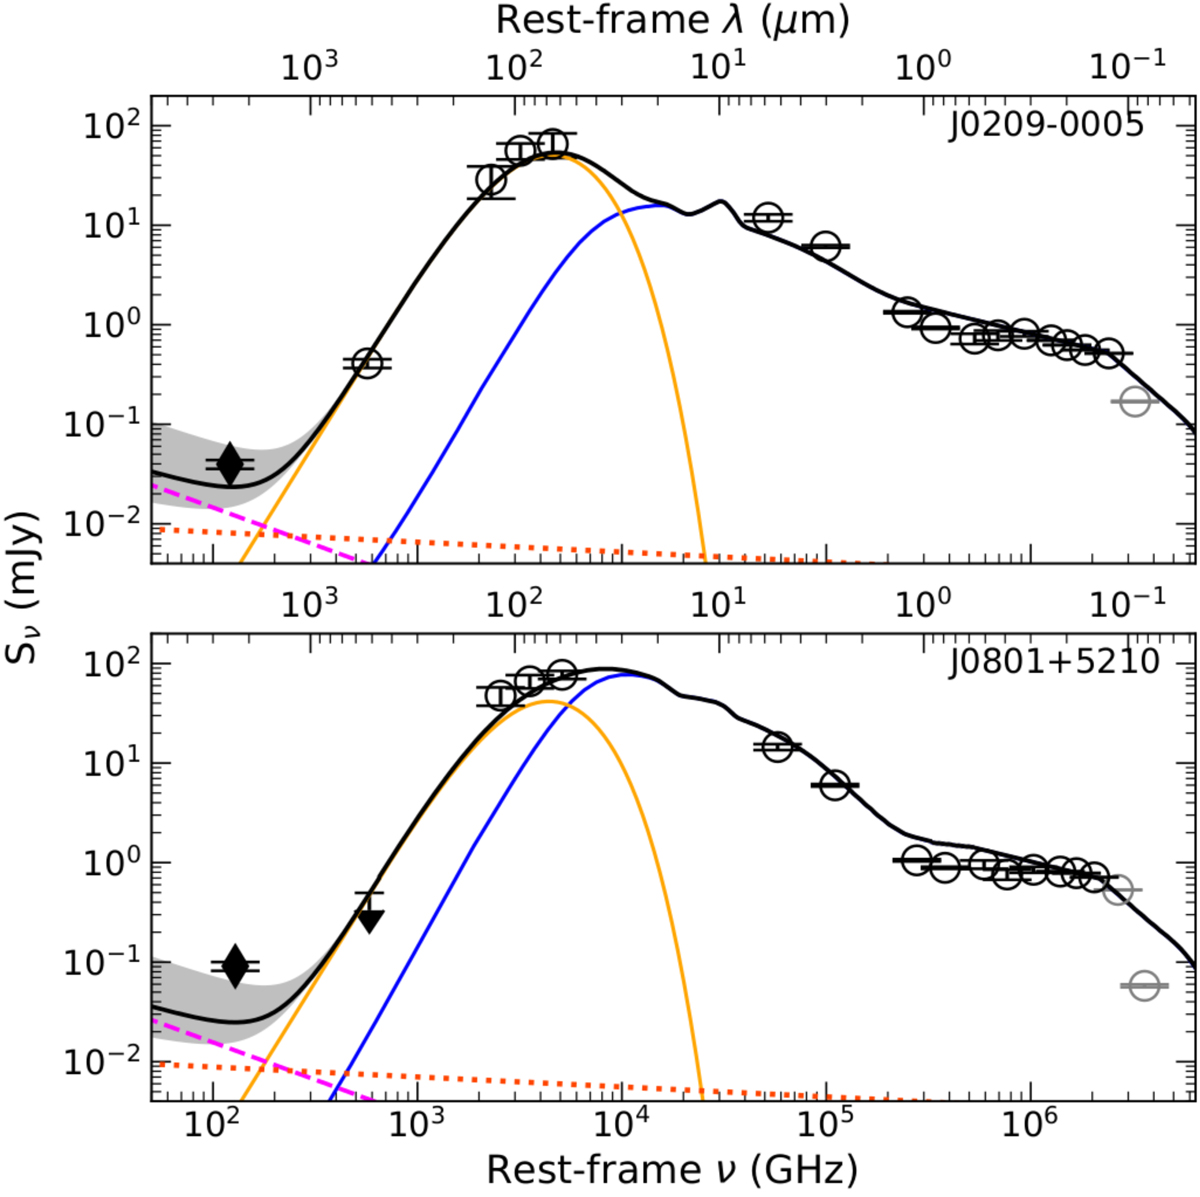
Rest-frame SED of J0209–0005 (top) and J0801+5210 (bottom). In each panel, black circles indicate the photometric points considered (arrows represent 3σ upper limits). Photometric points at λ < 1216 Å are not included in the fits due to Lyα absorption (grey circles). Rest-frame 125 GHz continuum data (not included in the fit) are shown by diamonds. Black curve represents the total best fit model, while blue(orange) curve refers to the QSO(cold dust) emission component. Synchrotron and free free emission are shown by the dashed and dotted lines, respectively.
Current usage metrics show cumulative count of Article Views (full-text article views including HTML views, PDF and ePub downloads, according to the available data) and Abstracts Views on Vision4Press platform.
Data correspond to usage on the plateform after 2015. The current usage metrics is available 48-96 hours after online publication and is updated daily on week days.
Initial download of the metrics may take a while.