Fig. 4.
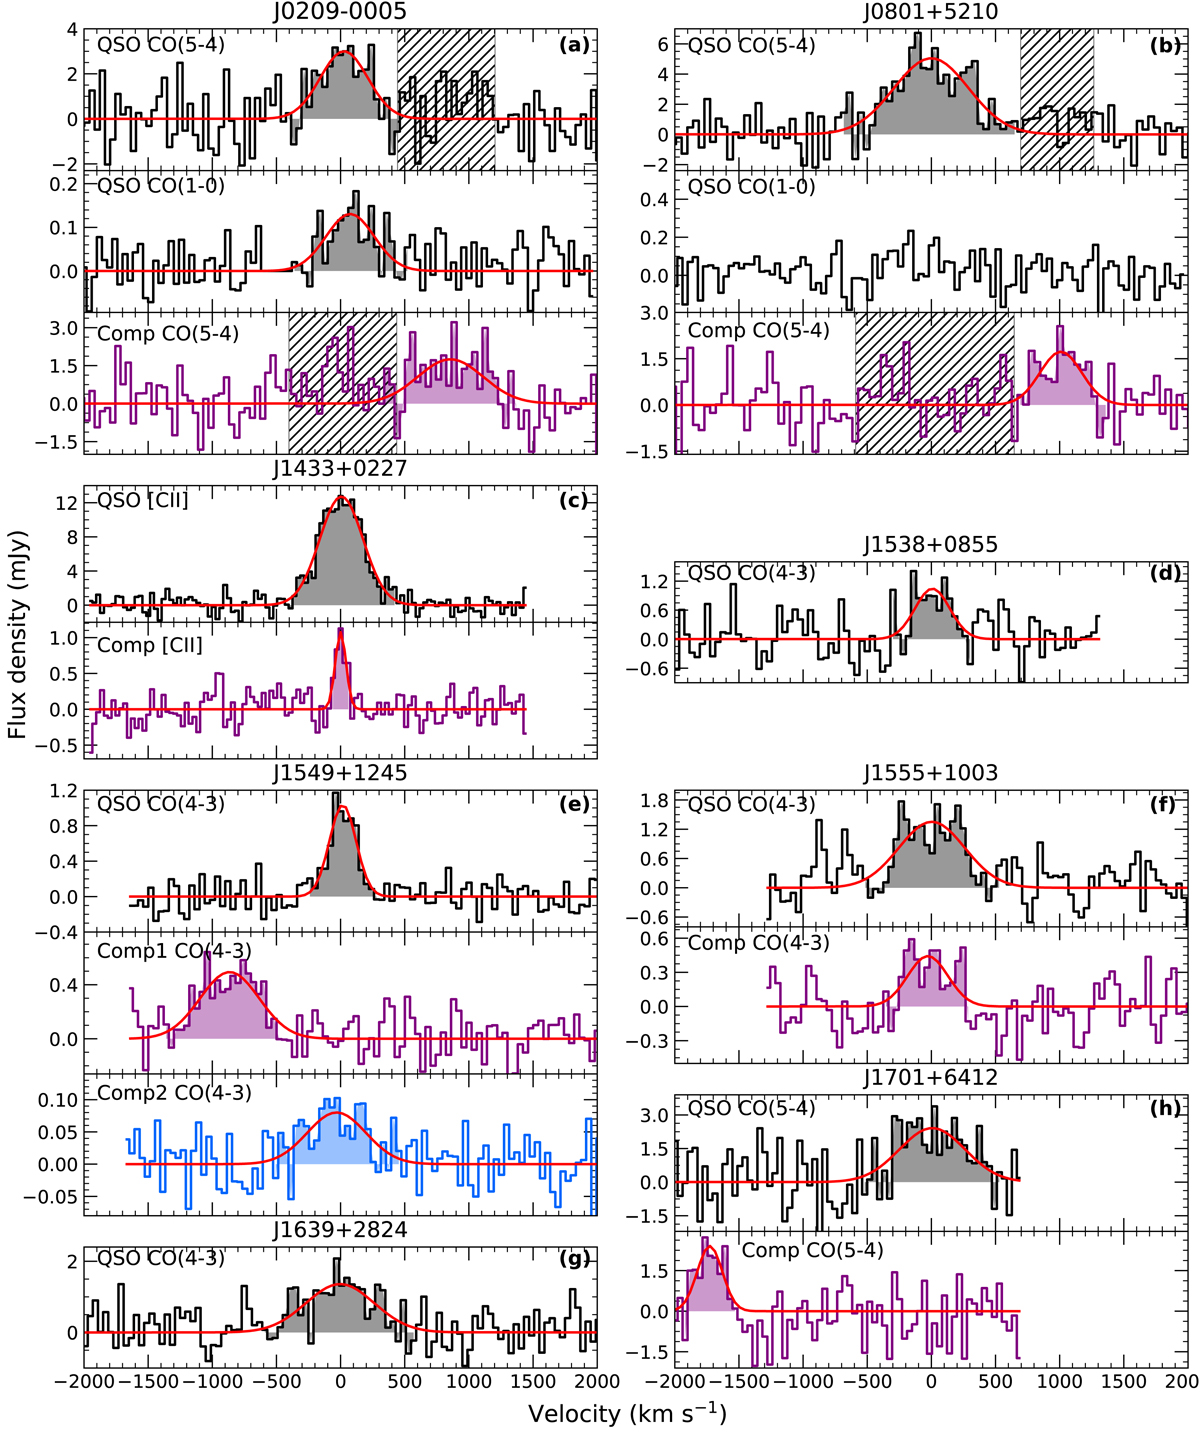
Spectra of the CO or [CII] emission lines for the WISSH QSOs analysed in this work. For each source, the targeted transition is indicated by the top label. Spectra were extracted from the region where emission from the QSO host-galaxy is detected with S/N > 2 (see Fig. 3) and show the velocity range v ∈ [ − 2000, +2000] km s−1 in channels of 40 km s−1. In case of (e), we preferred a circular extraction region with size of the ALMA beam, centred on the QSO position, to limit contamination from a nearby line emitting source at 0.6 arcsec separation (see Fig. 3e). The best-fit, Gaussian profiles are shown by the red curve. The filled histogram indicates velocity channels in which emission in the QSO and companion spectra is > 5% than the peak flux of the best-fit model. Panels a and b: grey spectral regions were excluded from the fit because associated with line emission from nearby sources (see Sect. 3.2) partially unresolved by the NOEMA beam.
Current usage metrics show cumulative count of Article Views (full-text article views including HTML views, PDF and ePub downloads, according to the available data) and Abstracts Views on Vision4Press platform.
Data correspond to usage on the plateform after 2015. The current usage metrics is available 48-96 hours after online publication and is updated daily on week days.
Initial download of the metrics may take a while.