Fig. 3.
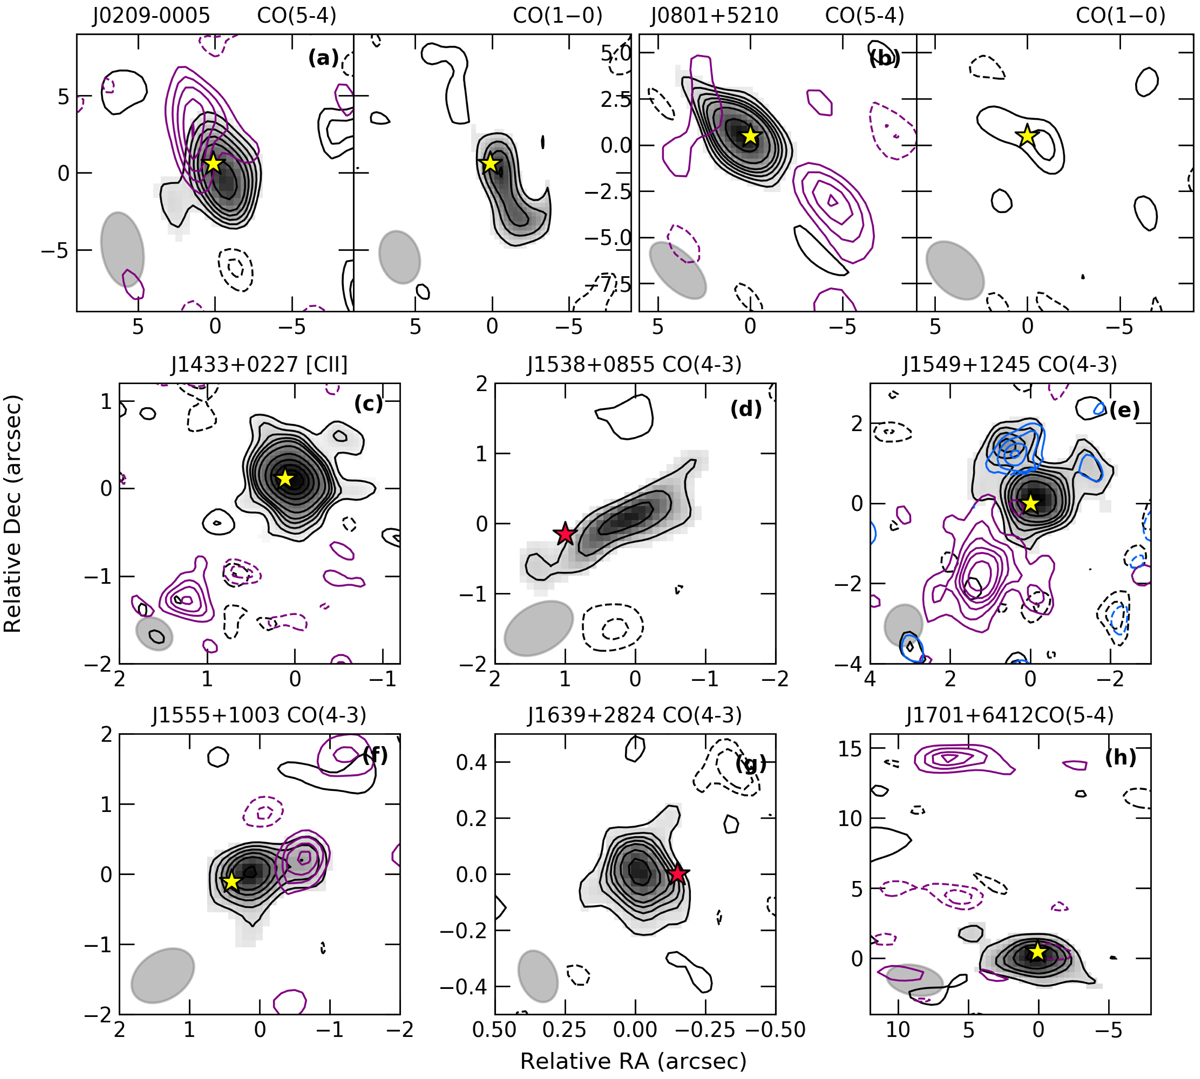
Maps of the cold gas emission for the WISSH QSOs analysed in this work, obtained by integrating over the spectral range covered by CO or [CII] emission. For each source, the targeted transition is indicated by the top label. Grayscale defines the region where line emission from the QSO host-galaxy is detected with S/N ≳ 4.5. Black contours correspond to [−3, −2, 2, 3, 4, 5, 6, 8, 12, 16, 32, …]σcold in the QSO map, where σcold = 0.16, 0.012 Jy beam−1 km s−1 for CO(5−4) and CO(1−0) observations in panel a and 0.22, 0.032 Jy beam−1 km s−1 in panel b. Panels c–h: σcold = 0.091, 0.098, 0.021, 0.11, 0.082, 0.18 Jy beam−1 km s−1, respectively. Similarly, magenta and blue contours identify emission from companion line emitters. Panel e: blue contours have been created by masking QSO emission in a circular aperture of 1 arcsec radius centred on the QSO location. Dashed contours are for negative values. Yellow (red) stars indicate the QSO position as traced by the millimetre (optical) continuum. The beam of each observation is also shown by the grey ellipse.
Current usage metrics show cumulative count of Article Views (full-text article views including HTML views, PDF and ePub downloads, according to the available data) and Abstracts Views on Vision4Press platform.
Data correspond to usage on the plateform after 2015. The current usage metrics is available 48-96 hours after online publication and is updated daily on week days.
Initial download of the metrics may take a while.