Fig. 2.
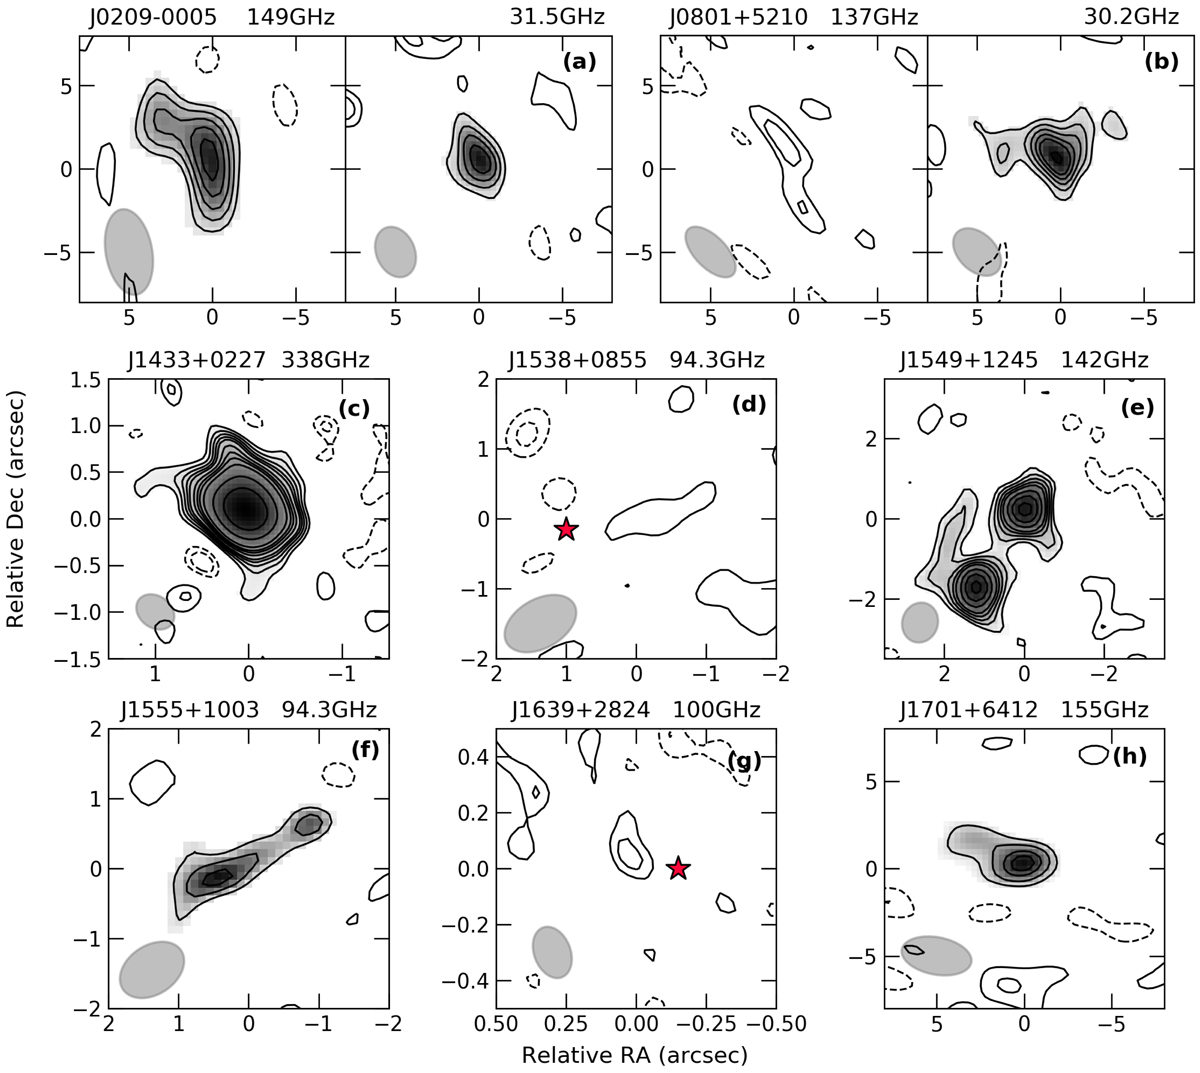
Maps of the continuum emission for the WISSH QSOs analysed in this work. For each panel, the observed continuum frequency is indicated by the top label. Grayscale defines the region where emission from the QSO host-galaxy and nearby continuum emitters is detected with S/N ≳ 4.5. Black contours correspond to [−3, −2, 2, 3, 4, 5, 6, 8, 12, 16, 32, …]σcont, where σcont values are listed in Table 1. Dashed contours are for negative values. The beam of each observation is also shown by the grey ellipse. Panels d and g: the red star indicates the QSO optical position from SDSS.
Current usage metrics show cumulative count of Article Views (full-text article views including HTML views, PDF and ePub downloads, according to the available data) and Abstracts Views on Vision4Press platform.
Data correspond to usage on the plateform after 2015. The current usage metrics is available 48-96 hours after online publication and is updated daily on week days.
Initial download of the metrics may take a while.