Fig. A.1.
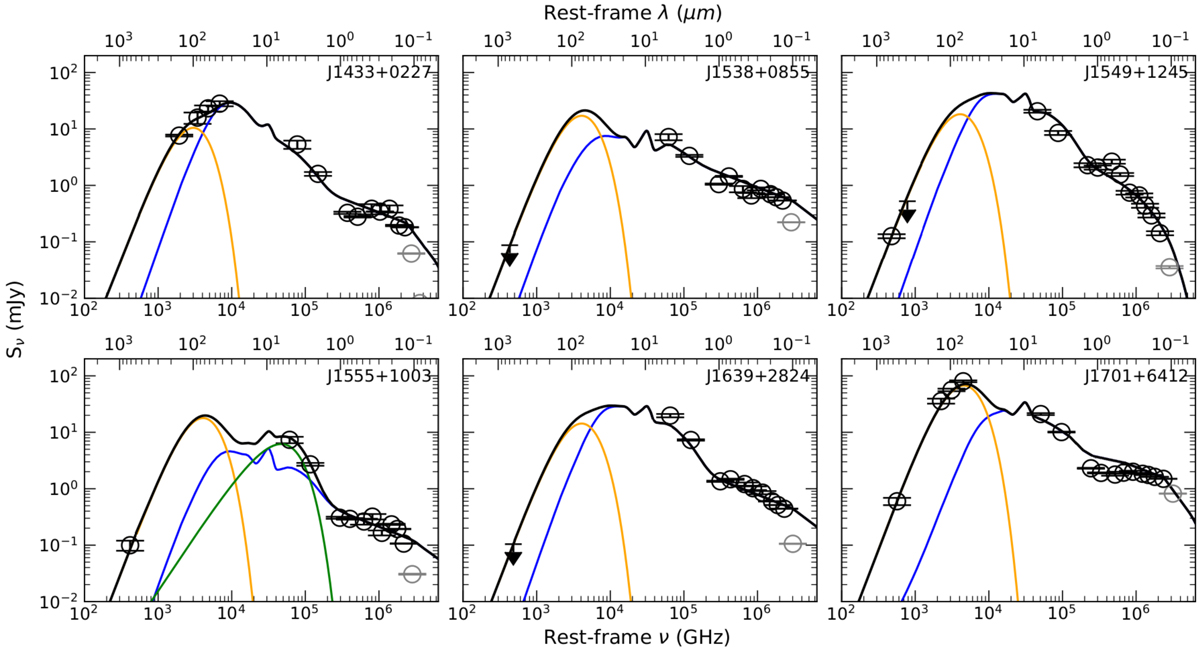
Rest-frame SED of the WISSH QSOs considered in this work. In each panel, black symbols indicate the photometric points considered in our modelling. Black circles identify detections while arrows represent 3σ upper limits (see Table 1). Photometric points at λ < 1216 Å are not included in the fits due to Lyα absorption (grey circles). Black curve represents the total best fit model, while blue and orange curves refer to the accretion disk plus torus and cold dust emission, respectively. In the case of J1555+1003, the green curve represents the best-fit template reproducing the near-IR excess (for details, see Duras et al. 2017).
Current usage metrics show cumulative count of Article Views (full-text article views including HTML views, PDF and ePub downloads, according to the available data) and Abstracts Views on Vision4Press platform.
Data correspond to usage on the plateform after 2015. The current usage metrics is available 48-96 hours after online publication and is updated daily on week days.
Initial download of the metrics may take a while.