Fig. 10.
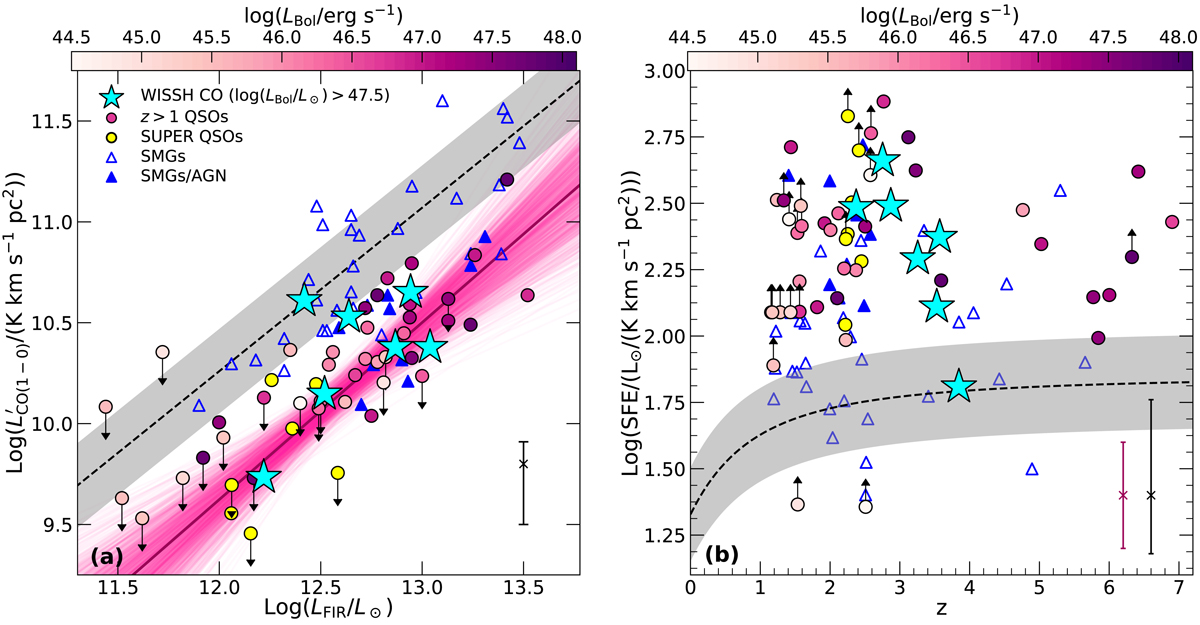
Panel a: CO(1−0) luminosity as a function of the infrared luminosity for the WISSH QSOs analysed in this work (cyan stars), compared with a sample of QSOs and SMGs from literature (see text for details). We show the best-fit ![]() vs. LIR relation measured for the QSOs sample (solid line), as compared to the relation found for MS galaxies by Sargent et al. (2014), Speagle et al. (2014) (dashed line), characterised by a 0.2 dex scatter (grey shaded area). A thousand random realisations from our Bayesian fit are also shown (pink lines). Top colorbar indicates the AGN bolometric luminosity for the z > 1 QSOs collection from literature. Error bar indicates the uncertainty on
vs. LIR relation measured for the QSOs sample (solid line), as compared to the relation found for MS galaxies by Sargent et al. (2014), Speagle et al. (2014) (dashed line), characterised by a 0.2 dex scatter (grey shaded area). A thousand random realisations from our Bayesian fit are also shown (pink lines). Top colorbar indicates the AGN bolometric luminosity for the z > 1 QSOs collection from literature. Error bar indicates the uncertainty on ![]() associated with the assumption of a CO SLED, given the range of CO(5−4)/CO(1−0) ratios measured in high-z QSOs (Fig. 5). Panel b: star formation efficiency as a function of redshift, compared to the SFE of MS galaxies with M* ∼ 1011 M⊙ (black line with grey area). Black (purple) error bar indicates the typical uncertainty on SFE for WISSH targets including (without including) the systematic error on the assumption of a CO SLED (see Sect. 3.3).
associated with the assumption of a CO SLED, given the range of CO(5−4)/CO(1−0) ratios measured in high-z QSOs (Fig. 5). Panel b: star formation efficiency as a function of redshift, compared to the SFE of MS galaxies with M* ∼ 1011 M⊙ (black line with grey area). Black (purple) error bar indicates the typical uncertainty on SFE for WISSH targets including (without including) the systematic error on the assumption of a CO SLED (see Sect. 3.3).
Current usage metrics show cumulative count of Article Views (full-text article views including HTML views, PDF and ePub downloads, according to the available data) and Abstracts Views on Vision4Press platform.
Data correspond to usage on the plateform after 2015. The current usage metrics is available 48-96 hours after online publication and is updated daily on week days.
Initial download of the metrics may take a while.