Fig. 7.
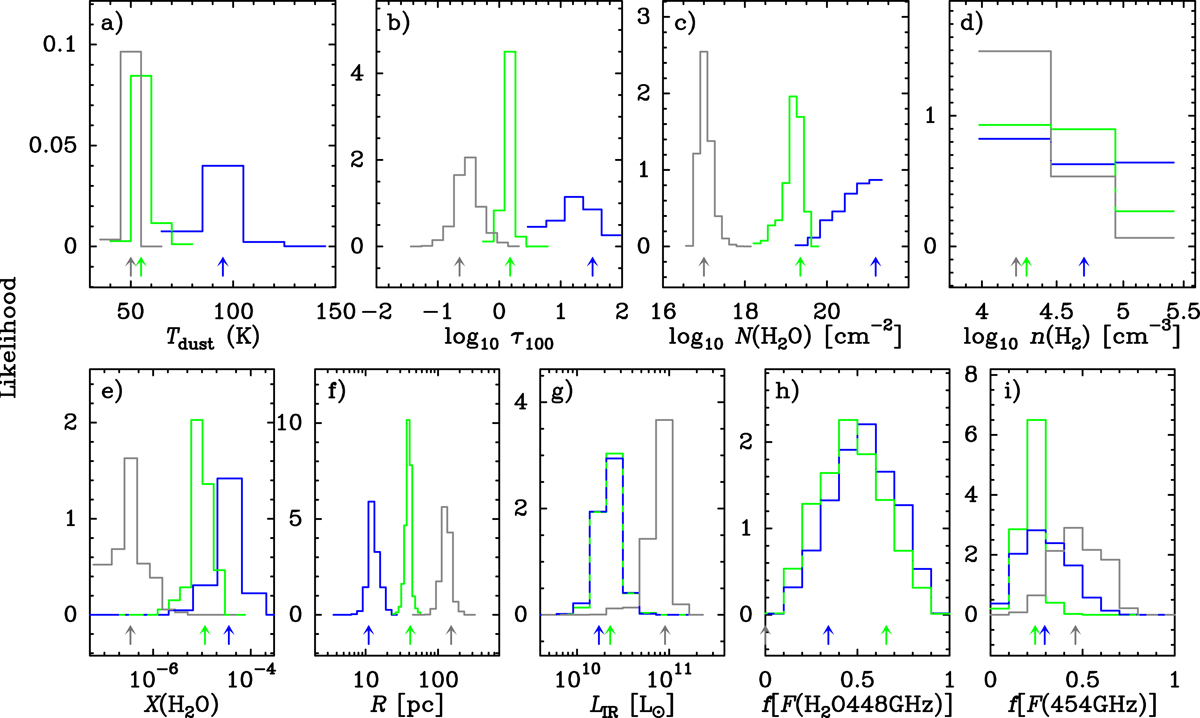
Bayesian analysis showing the probability densities of the physical parameters associated with the core (blue histograms), disk (green), and envelope (gray). Panels a–d: results for the free physical parameters (Tdust, τ100, N(H2O), and n(H2)); panels e-i: results for the derived parameters (X(H2O), R, LIR, and the fractions f of the 448 GHz continuum and of the H2O448 emission that arise from each component). The small arrows at the bottom of each panel indicate the values of the fiducial model in Fig. 6. In panel h, the contribution f to the H2O448 line from the envelope is not shown because it is negligible in all models. The median and 90% confidence intervals are listed in Table 2.
Current usage metrics show cumulative count of Article Views (full-text article views including HTML views, PDF and ePub downloads, according to the available data) and Abstracts Views on Vision4Press platform.
Data correspond to usage on the plateform after 2015. The current usage metrics is available 48-96 hours after online publication and is updated daily on week days.
Initial download of the metrics may take a while.