Fig. 6.
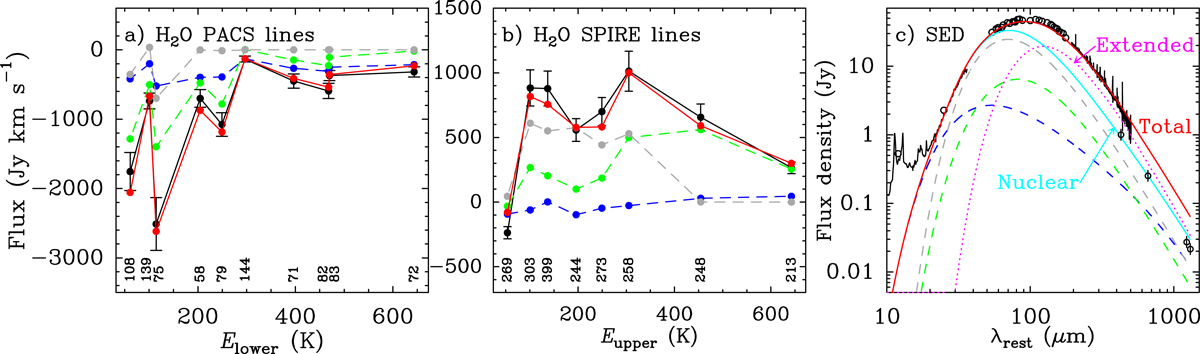
Our fiducial model fit (with parameters listed in Table 2) to the H2O PACS lines (panel a), H2O SPIRE lines (panel b), and the SED (panel c). Dashed blue, green, and gray lines indicate results for the three nuclear components: the core, the disk, and the envelope, respectively. Panels a–b: combined (total) absorption or emission of the three components is shown in red, and the small numbers at the bottom indicate the approximate wavelength of the line. Panel c: circles at < 200 μm show both IRAS data and Herschel/PACS spectrophotometric data (see Appendix A), with uncertainties better than 15%, and circles with error bars at > 400 μm are ALMA data for the nuclear region modeled in this work; we also show the Spitzer/IRS and the Herschel/SPIRE spectra. The continuum of the combined three nuclear components related to H2O is shown in light-blue, and a nonnuclear (extended) component (in magenta, with Tdust = 28 K) is required to reproduce the full SED at long wavelengths. The red line indicates the total (nuclear+extended) modeled SED.
Current usage metrics show cumulative count of Article Views (full-text article views including HTML views, PDF and ePub downloads, according to the available data) and Abstracts Views on Vision4Press platform.
Data correspond to usage on the plateform after 2015. The current usage metrics is available 48-96 hours after online publication and is updated daily on week days.
Initial download of the metrics may take a while.