Fig. 3.
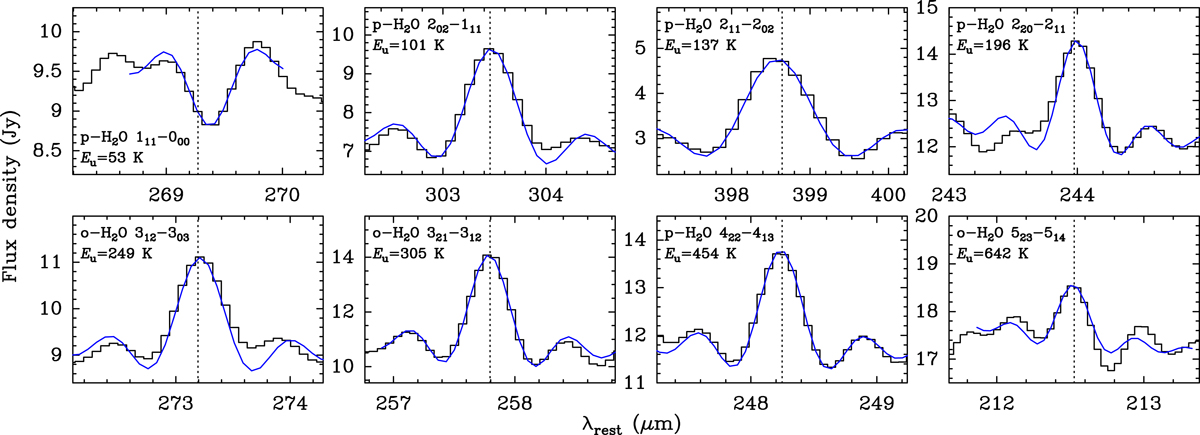
Spectra around the H2O lines in ESO 320-G030 observed with Herschel/SPIRE, along with sinc fits to the lines (blue curves). In all panels, the plotted wavelength range corresponds to a velocity range of ±1200 km s−1. The vertical dotted lines indicate the expected central position of the lines by using z = 0.01026, as in Fig. 2. The lines are sorted by the upper-level energy (Eu) of the transition, which is indicated in each panel.
Current usage metrics show cumulative count of Article Views (full-text article views including HTML views, PDF and ePub downloads, according to the available data) and Abstracts Views on Vision4Press platform.
Data correspond to usage on the plateform after 2015. The current usage metrics is available 48-96 hours after online publication and is updated daily on week days.
Initial download of the metrics may take a while.