Fig. B.1.
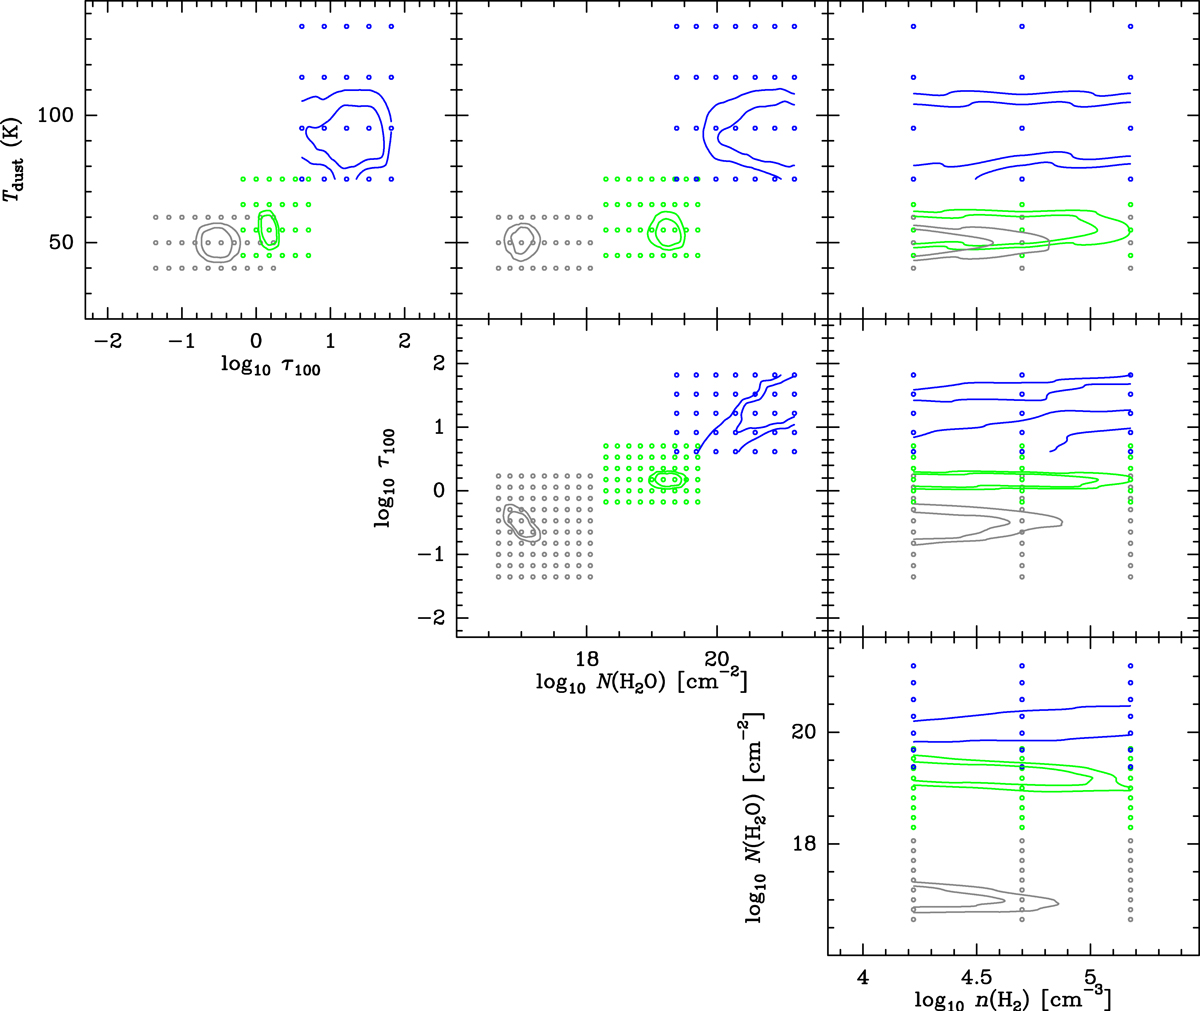
2D marginalized posterior distributions of the free physical parameters of each component (Tdust, τ100, NH2O, nH2) included in our fits to the H2O fluxes and continuum flux densities (Sect. 3.1.5). Each panel displays contours at 25% and 50% of the peak likelihood in the parameter-parameter space for each of the three components. Blue, green, and gray colors correspond to the core, the nuclear disk, and the envelope, respectively.
Current usage metrics show cumulative count of Article Views (full-text article views including HTML views, PDF and ePub downloads, according to the available data) and Abstracts Views on Vision4Press platform.
Data correspond to usage on the plateform after 2015. The current usage metrics is available 48-96 hours after online publication and is updated daily on week days.
Initial download of the metrics may take a while.