Free Access
Fig. 19.
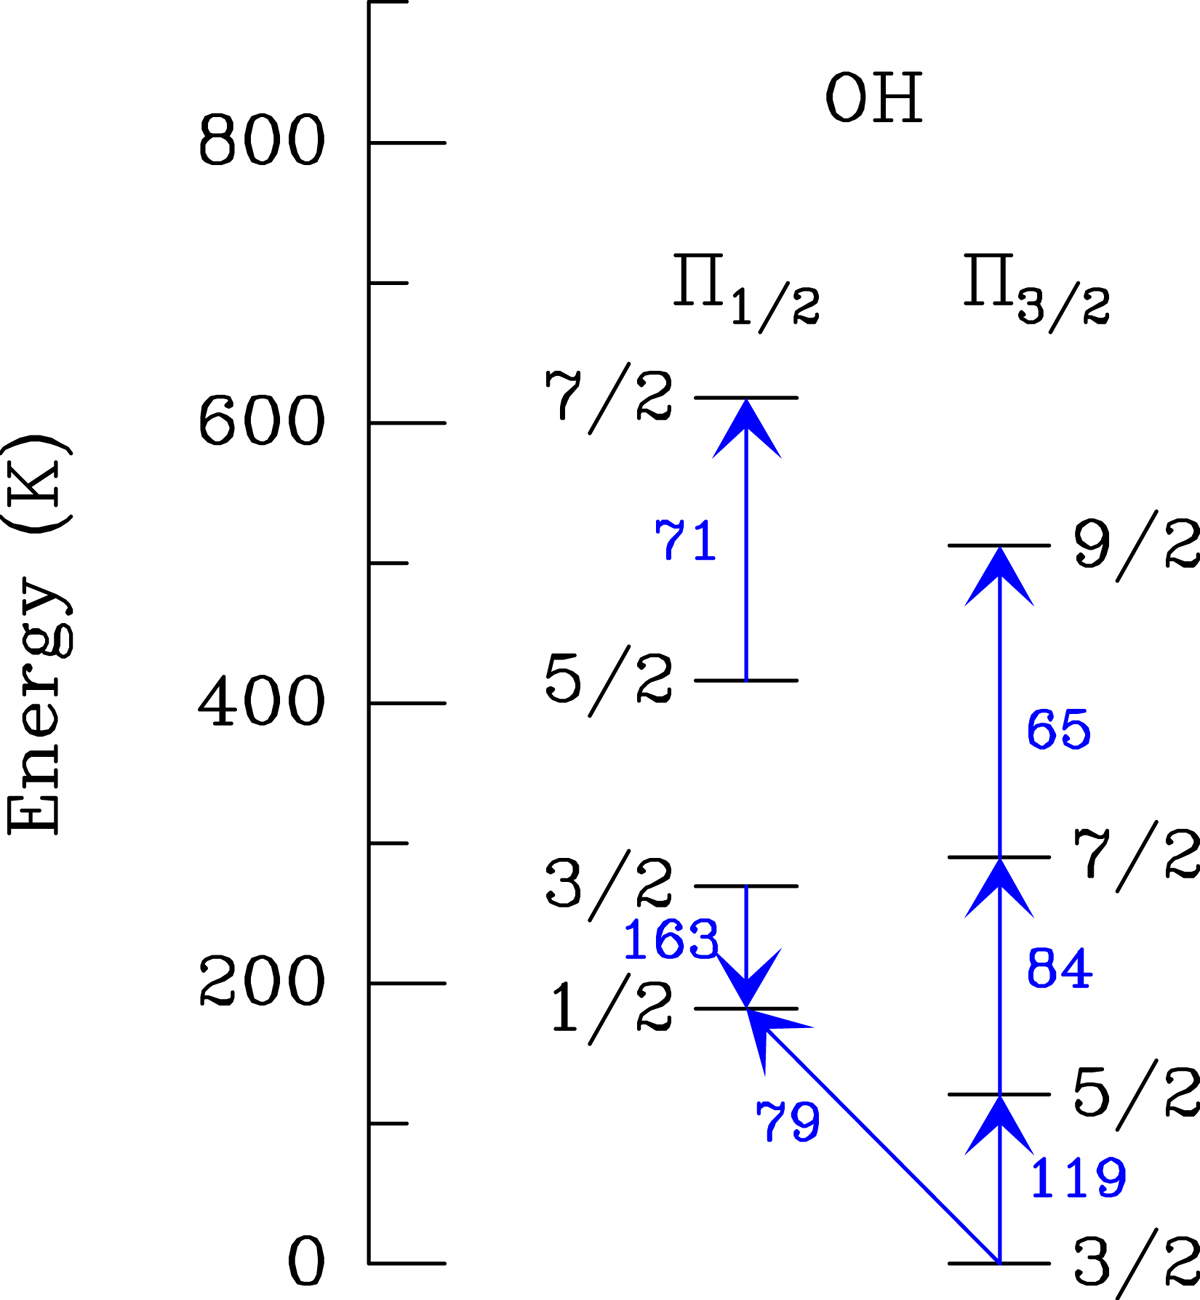
Energy level diagram of OH indicating the lines observed with Herschel/PACS (blue arrows and labels). Labels denote the rounded wavelengths in μm. Upward (downward) arrows indicate lines detected primarily in absorption (emission).
Current usage metrics show cumulative count of Article Views (full-text article views including HTML views, PDF and ePub downloads, according to the available data) and Abstracts Views on Vision4Press platform.
Data correspond to usage on the plateform after 2015. The current usage metrics is available 48-96 hours after online publication and is updated daily on week days.
Initial download of the metrics may take a while.