Fig. 18.
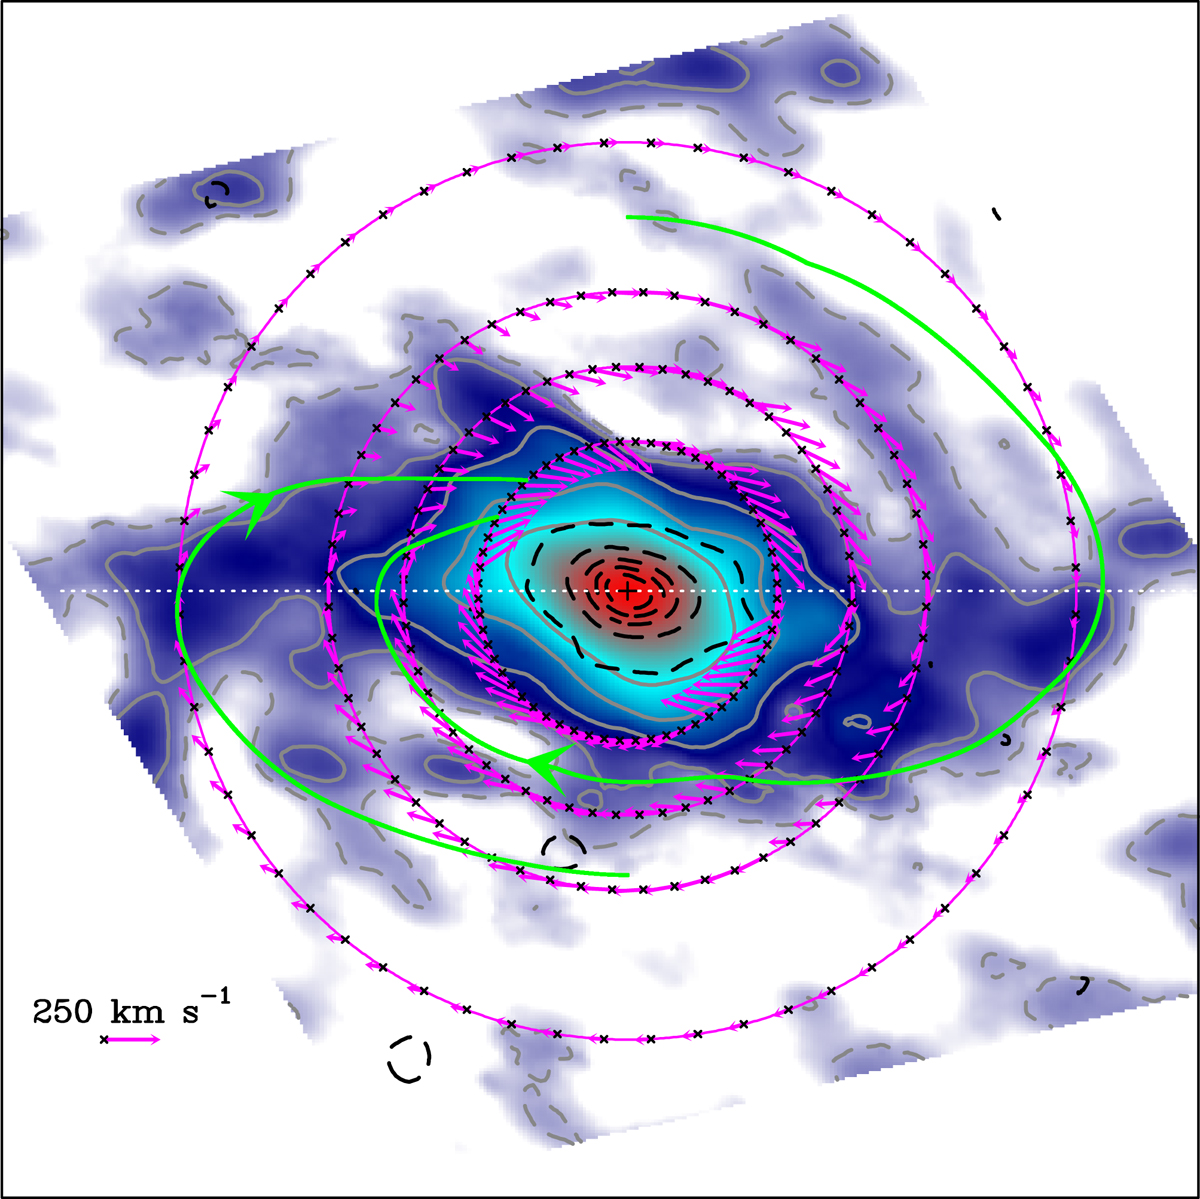
Deprojected images of the CO 2 − 1 emission (colored scale and gray contours) and of the 454 GHz continuum (dashed black contours), which have been also rotated to have the bar (dotted white line) horizontal. The magenta arrows show the inferred velocity vectors along the r = 1″ − 3″ circles in the frame of the rotating bar, after correcting for an assumed nuclear bar pattern speed of Ωs = 250 km s−1 kpc−1. The green lines are the result of integrating the velocity vector in this rotating frame (with linear radial interpolation of the velocity field), with departing points at ±90° from the bar and r = 1.9″ − 2.5″, up to the point where they intersect the r = 1″ circle.
Current usage metrics show cumulative count of Article Views (full-text article views including HTML views, PDF and ePub downloads, according to the available data) and Abstracts Views on Vision4Press platform.
Data correspond to usage on the plateform after 2015. The current usage metrics is available 48-96 hours after online publication and is updated daily on week days.
Initial download of the metrics may take a while.