Fig. 17.
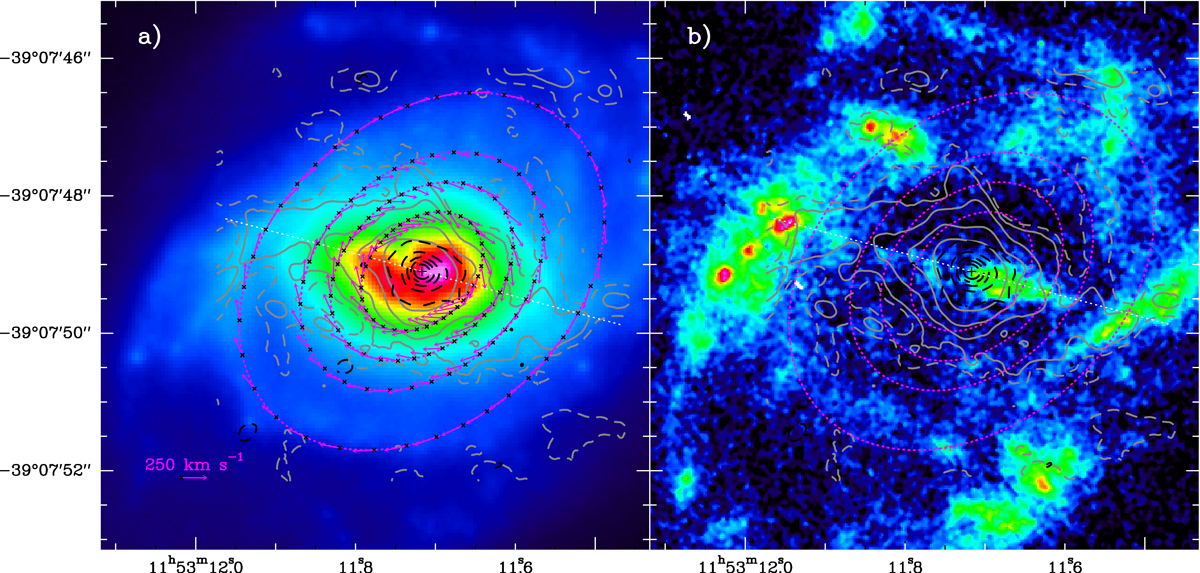
Images of the central region of ESO 320-G030 in VLT/NACO K-band (Crespo Gómez et al., in prep.; panel a) and in the HST/NICMOS2 F190N-F187N (continuum-subtracted Pa-α, from Alonso-Herrero et al. 2006, reprocessed using the latest NICMOS pipeline by Sánchez-García et al. in prep.; panel b). The CO (2–1) emission observed with ALMA (gray contours) and the 454 GHz continuum (dashed black contours) are overlaid in both panels. The direction of the nuclear gas bar is indicated by the dotted white line (PA = 75°). The four outer circles of Figs. 15a–c (r = 1″ − 3″) where the velocity field is estimated are also indicated, with the arrows in panel a showing the gas velocity vectors projected on the plane of sky. The cross marks the position of the peak emission in CO, H2O448, and 454 GHz continuum. For consistency with the ALMA astrometry, the VLT and HST images were aligned to the Gaia catalog using several stars in the field. The spatial resolutions are ∼0.25″ and ∼0.15″ for the VLT/NACO and HST/NICMOS images, respectively.
Current usage metrics show cumulative count of Article Views (full-text article views including HTML views, PDF and ePub downloads, according to the available data) and Abstracts Views on Vision4Press platform.
Data correspond to usage on the plateform after 2015. The current usage metrics is available 48-96 hours after online publication and is updated daily on week days.
Initial download of the metrics may take a while.