Fig. 16.
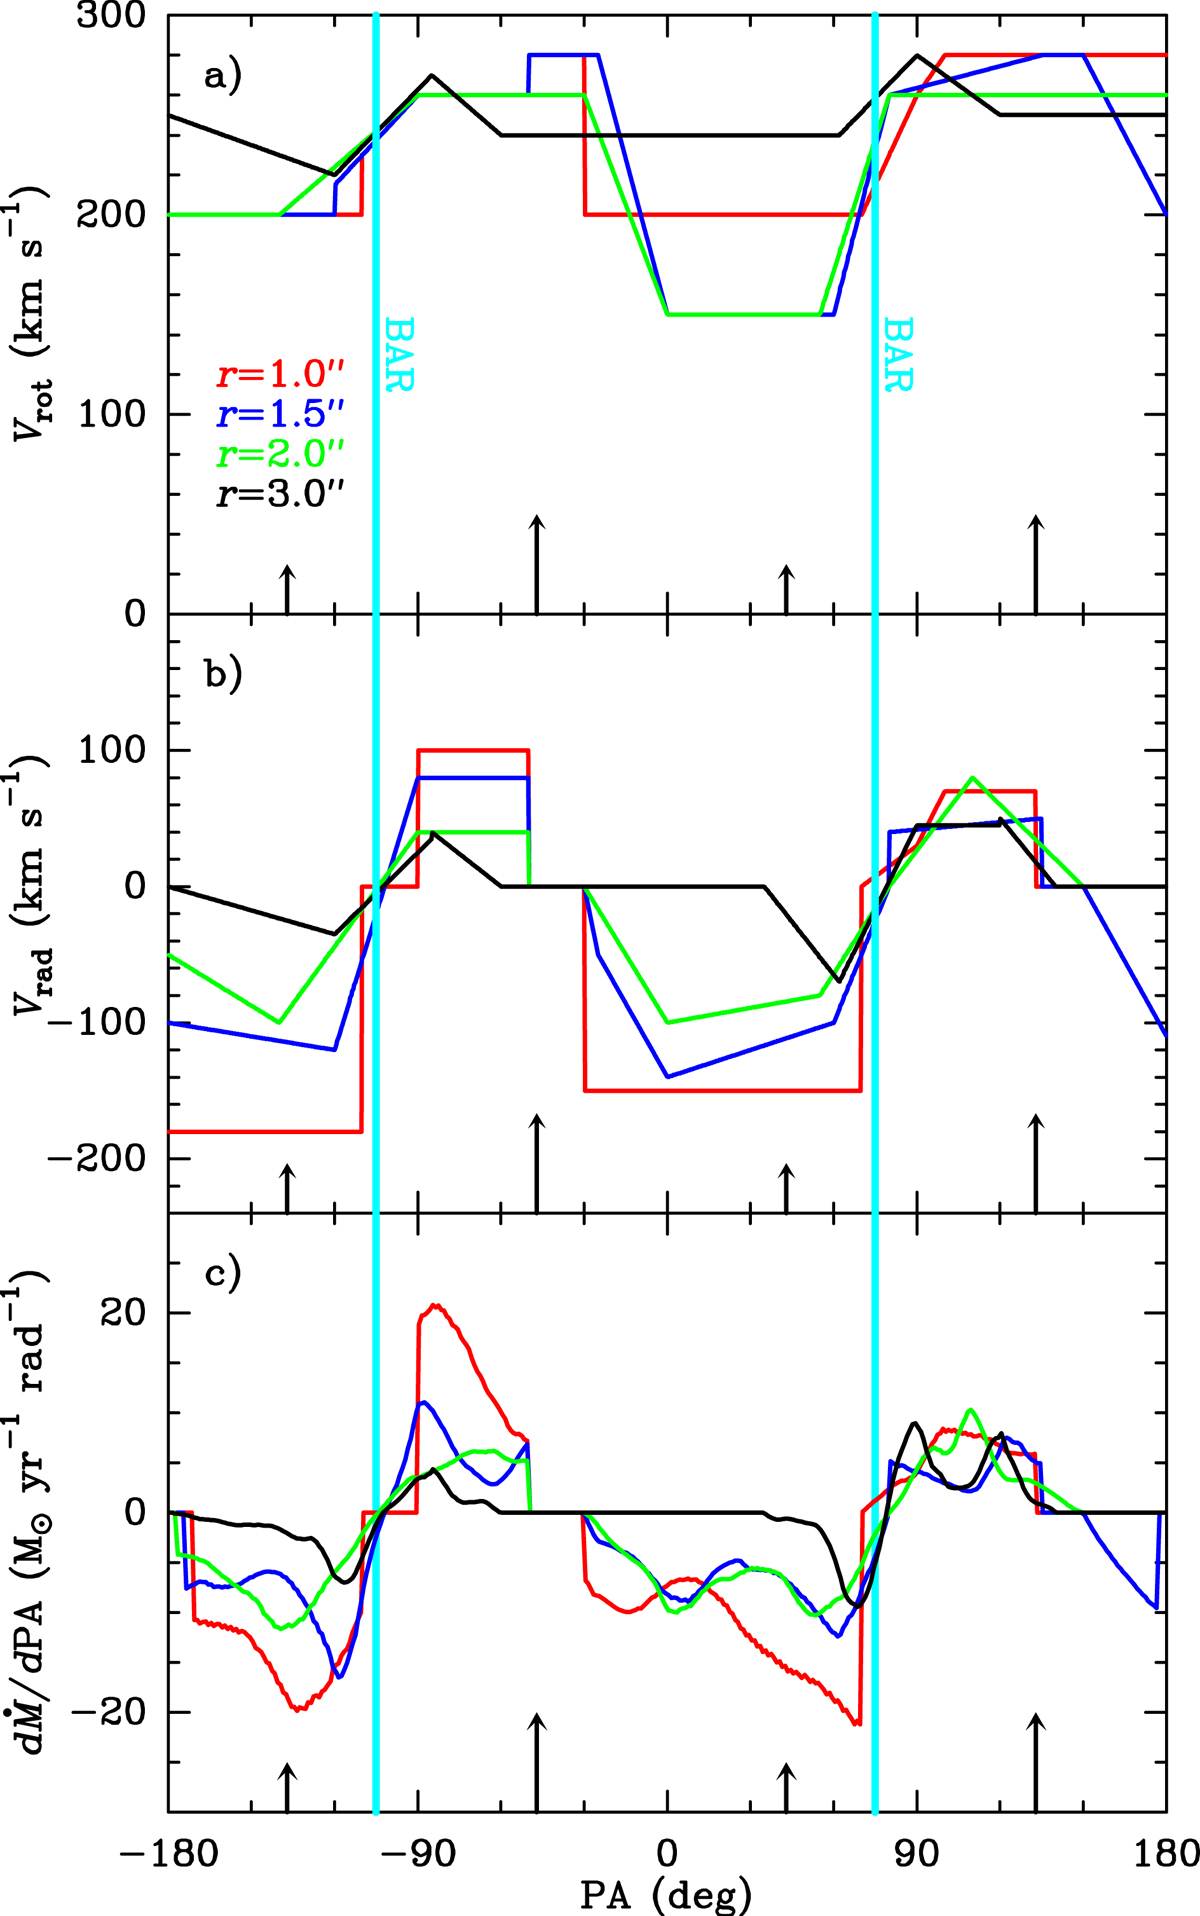
(a) Rotational and (b) radial velocity components of the gas along the four outer circles (r = 1″ − 3″) depicted in Figs. 15a–c, as derived from the CO (2–1) PV diagrams of Figs. 15d–g. (c) The rate at which gas mass is crossing the quoted circles per unit interval of PA. The PA of the bar is indicated with cyan vertical lines, and the vertical long and short arrows indicate the PA of the MKA and mKA, respectively. Values of Vrad and dṀ/dPA positive (negative) indicate gas flowing in the outward (inward) direction.
Current usage metrics show cumulative count of Article Views (full-text article views including HTML views, PDF and ePub downloads, according to the available data) and Abstracts Views on Vision4Press platform.
Data correspond to usage on the plateform after 2015. The current usage metrics is available 48-96 hours after online publication and is updated daily on week days.
Initial download of the metrics may take a while.