Fig. 12.
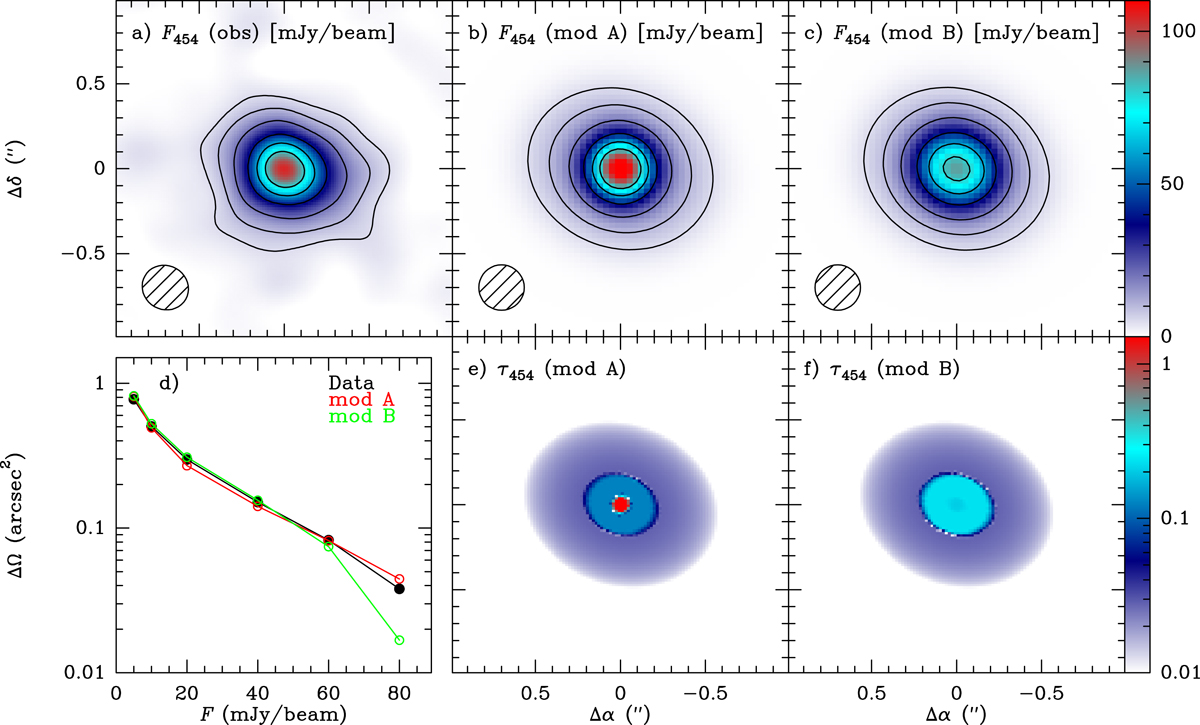
Comparison between the observed 454 GHz continuum map (panel a) and two 3D models (A and B) based on our fiducial model. In model A (panel b, with τ454 in panel e), the core component is assumed to be a real physical component concentrated at the center of the galaxy, and in model B (panel c, with τ454 in panel f), the core component is assumed to be widespread in the inner disk. Panel d compares the solid angle subtended by the plotted contours (5, 10, 20, 40, 60, and 80 mJy beam−1) in the observed map (black line and symbols) and in models A and B (red and green, respectively). Model A fits the observed map better than model B.
Current usage metrics show cumulative count of Article Views (full-text article views including HTML views, PDF and ePub downloads, according to the available data) and Abstracts Views on Vision4Press platform.
Data correspond to usage on the plateform after 2015. The current usage metrics is available 48-96 hours after online publication and is updated daily on week days.
Initial download of the metrics may take a while.