Fig. 10.
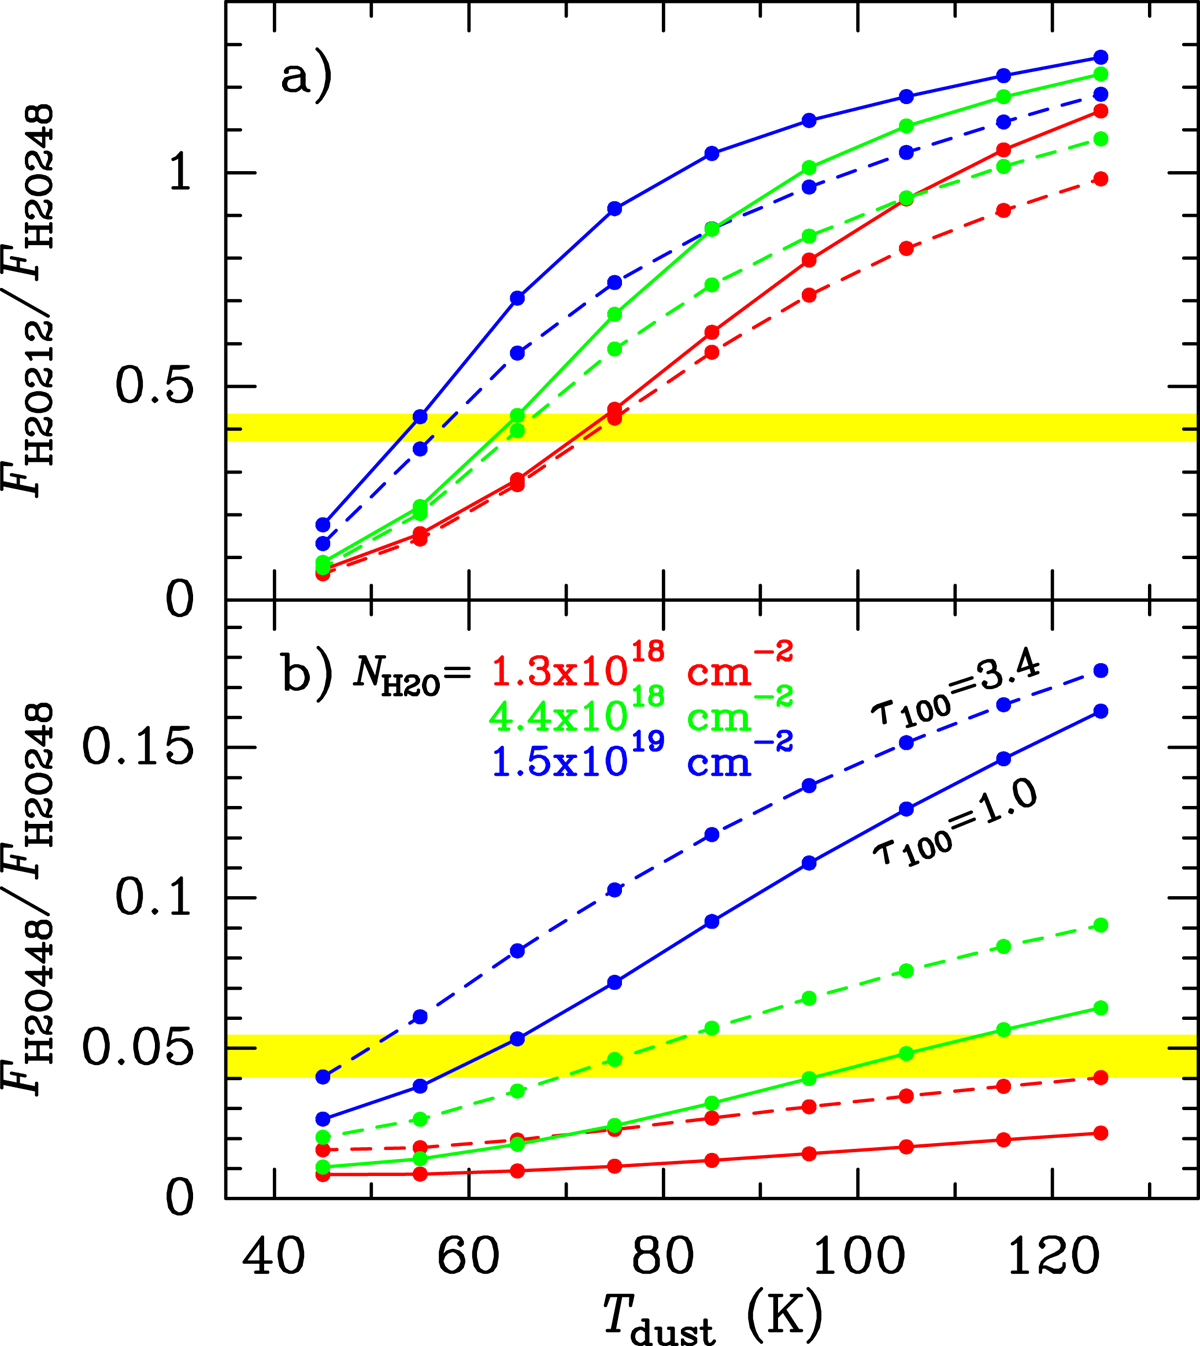
Modeled H2O line ratios as a function of Tdust (colored lines), compared with the measured ratios (appropriate for the disk, in yellow). The colors indicate the H2O column densities as indicated in panel b, and solid and dashed lines correspond to τ100 = 1.0 and 3.4, respectively. Panel b: the measured FH2O448/FH2O248 has been corrected by assuming that 70% of FH2O448 arises from the disk. While the observed FH2O212/FH2O248 ≈ 0.4 ratio in panel a can be explained with a range of Tdust and NH2O (increasing Tdust with decreasing NH2O), the measured FH2O448/FH2O248 breaks the degeneracy favoring the highest NH2O and moderate Tdust ≲ 65 K.
Current usage metrics show cumulative count of Article Views (full-text article views including HTML views, PDF and ePub downloads, according to the available data) and Abstracts Views on Vision4Press platform.
Data correspond to usage on the plateform after 2015. The current usage metrics is available 48-96 hours after online publication and is updated daily on week days.
Initial download of the metrics may take a while.