Fig. 1.
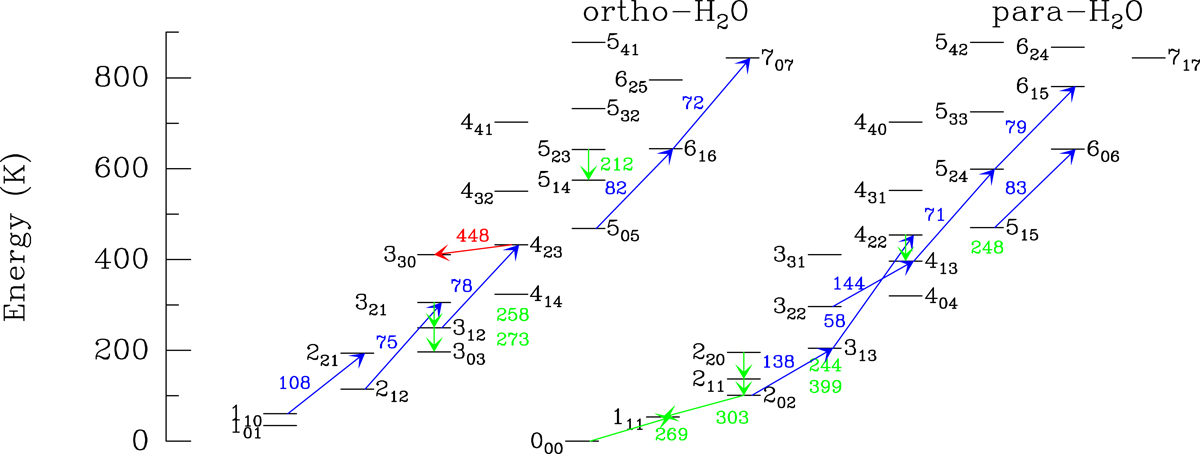
Energy level diagram of H2O indicating the lines observed with Herschel/PACS (blue arrows and labels), with Herschel/SPIRE (green), and with ALMA (red). Labels denote the rounded wavelengths in μm as indicated in the second column of Table 1, except for the line observed with ALMA which is denoted by its frequency in GHz. Upward (downward) arrows indicate lines detected in absorption (emission).
Current usage metrics show cumulative count of Article Views (full-text article views including HTML views, PDF and ePub downloads, according to the available data) and Abstracts Views on Vision4Press platform.
Data correspond to usage on the plateform after 2015. The current usage metrics is available 48-96 hours after online publication and is updated daily on week days.
Initial download of the metrics may take a while.