Fig. 18.
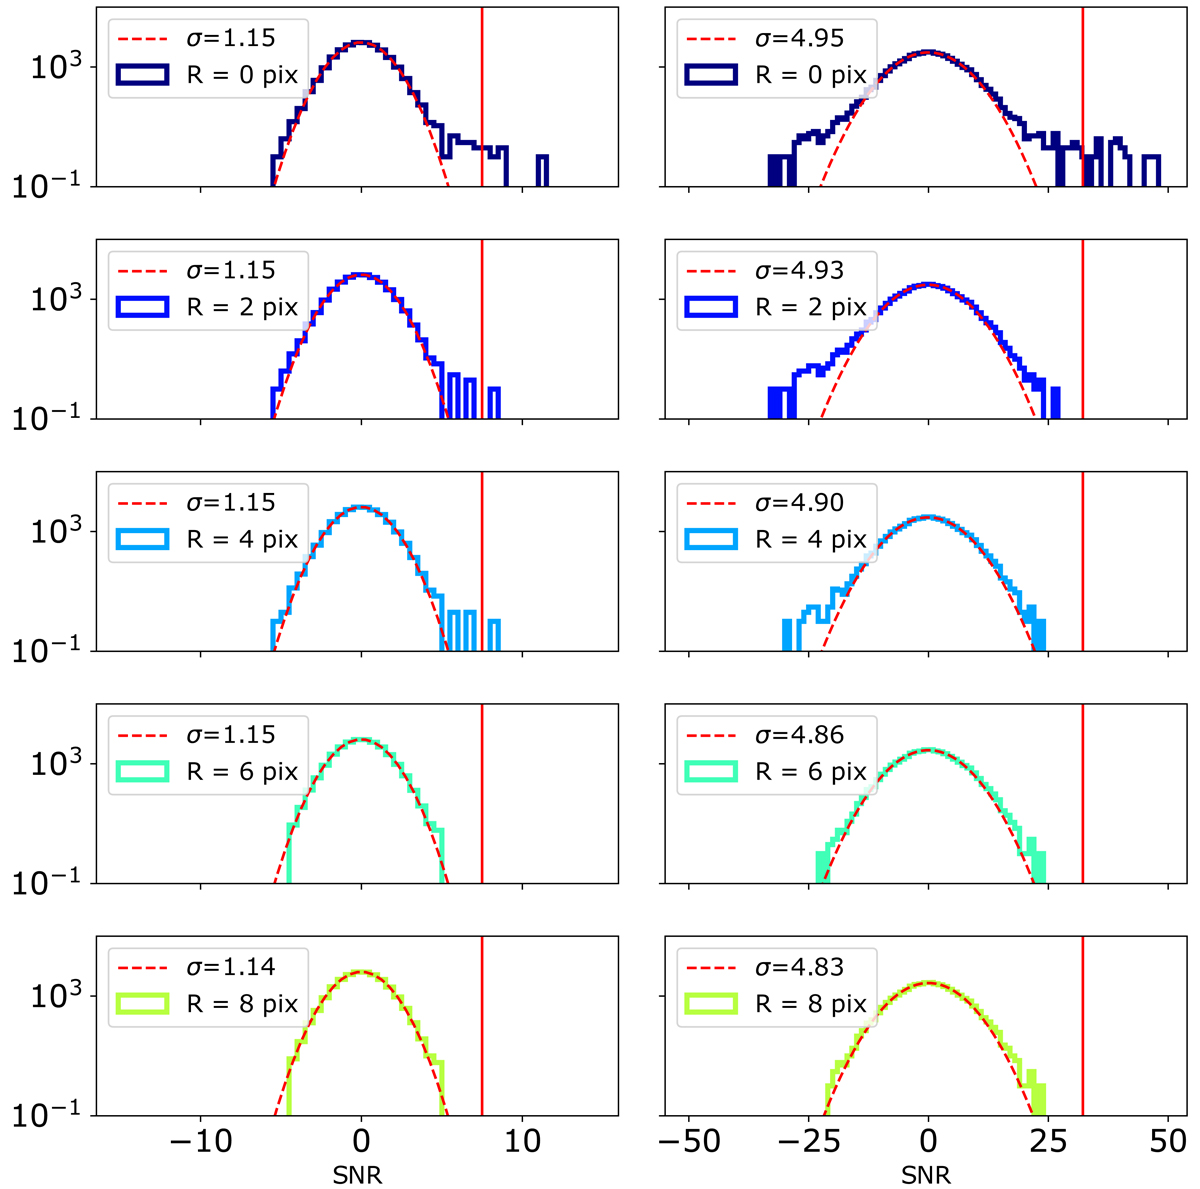
Distributions of the S/N in a sky image after deconvolution of a cleaned shadowgram for different radii used to exclude the sources. Left column: distribution of the S/N in the 20 s sky image of Fig. 13 (centre). Right column: distribution in 20 min sky image (same Fig., right). The red dashed lines correspond to a Gaussian function fitted to the distribution. With these distributions, the threshold to be applied for source detection would be 1.15 × 6.5 = 7.5 for the 20 s case, and 4.86 × 6.5 = 31.6 for the 20 min case, as indicated by the red vertical lines.
Current usage metrics show cumulative count of Article Views (full-text article views including HTML views, PDF and ePub downloads, according to the available data) and Abstracts Views on Vision4Press platform.
Data correspond to usage on the plateform after 2015. The current usage metrics is available 48-96 hours after online publication and is updated daily on week days.
Initial download of the metrics may take a while.