Fig. 17.
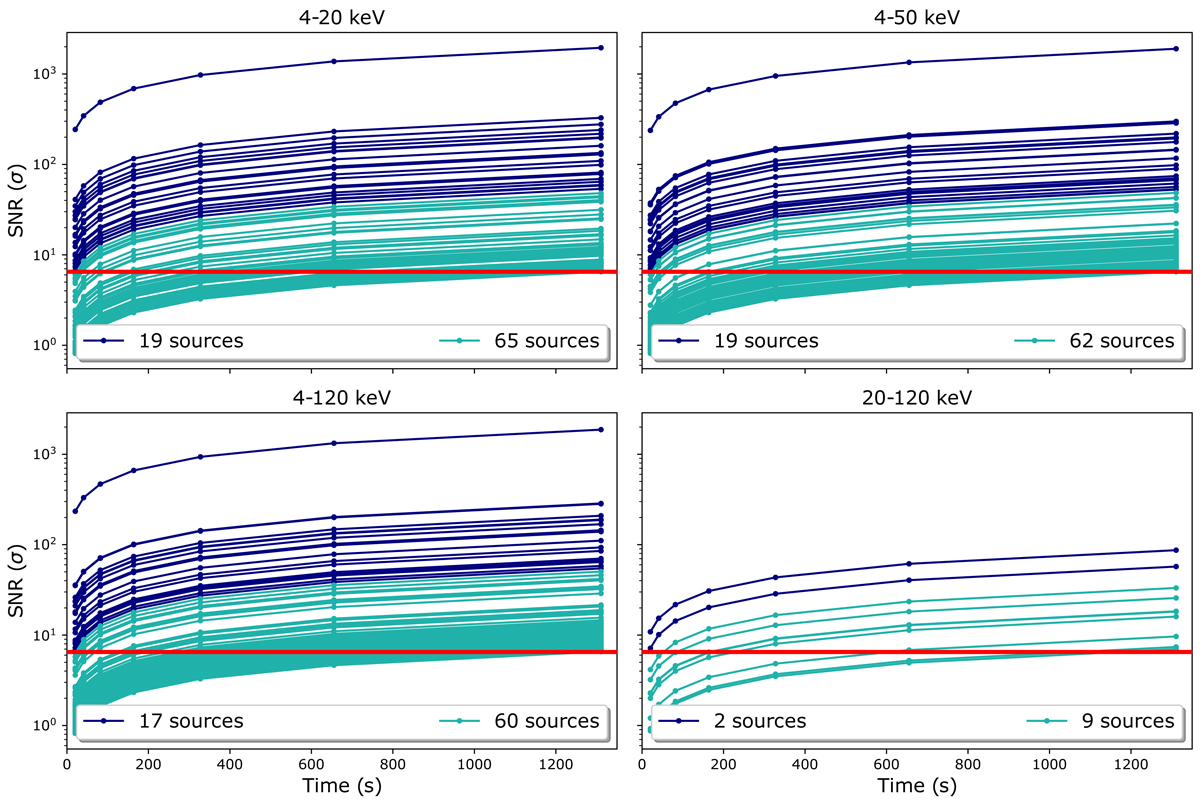
Typical S/N of the catalogue sources obtained after simulation of each source in the centre of the field of view. Dark blue (resp. cyan) curves correspond to the sources with S/N > 6.5 in 20 s (resp. 20 min). The red line corresponds to the threshold of 6.5σ. The four plots correspond to the energy bands foreseen for the onboard trigger algorithm.
Current usage metrics show cumulative count of Article Views (full-text article views including HTML views, PDF and ePub downloads, according to the available data) and Abstracts Views on Vision4Press platform.
Data correspond to usage on the plateform after 2015. The current usage metrics is available 48-96 hours after online publication and is updated daily on week days.
Initial download of the metrics may take a while.