Open Access
Fig. 14.
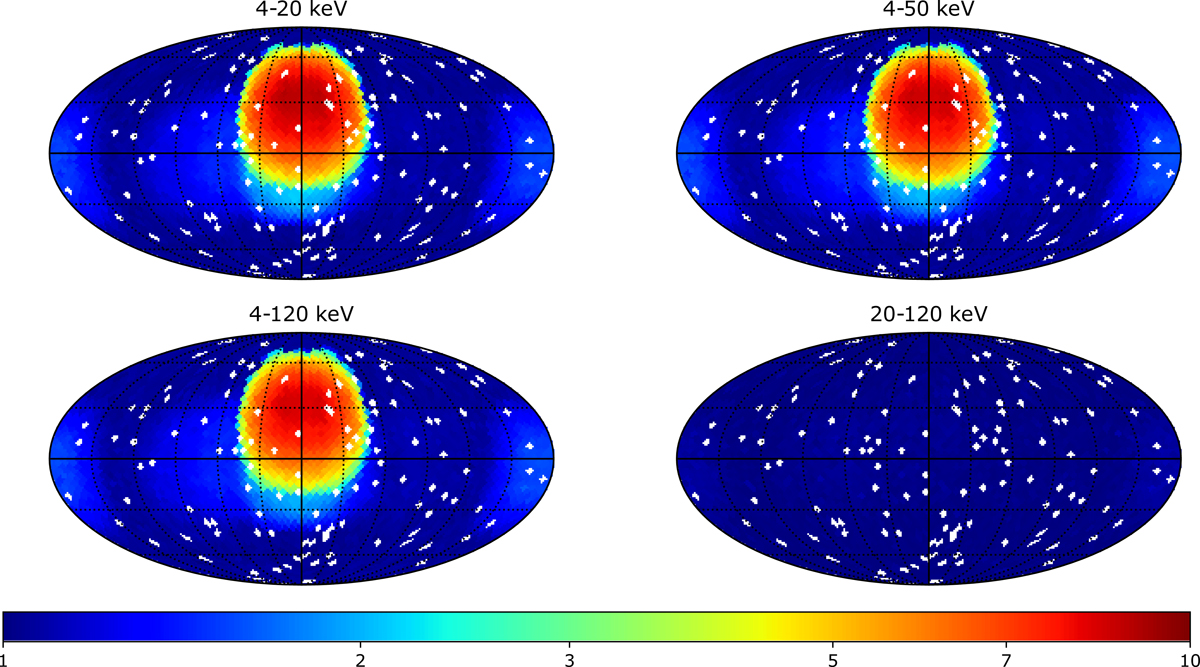
Standard deviation of S/N values in 20 s sky images according to the pointing direction in the sky in Galactic coordinates (longitude increasing from right to left). White pixels correspond to regions where no position has been drawn. The four maps correspond to the energy bands foreseen for the onboard trigger algorithm.
Current usage metrics show cumulative count of Article Views (full-text article views including HTML views, PDF and ePub downloads, according to the available data) and Abstracts Views on Vision4Press platform.
Data correspond to usage on the plateform after 2015. The current usage metrics is available 48-96 hours after online publication and is updated daily on week days.
Initial download of the metrics may take a while.